UNITED STATES
SECURITIES AND EXCHANGE COMMISSION
Washington, D.C. 20549
FORM 10-K
(Mark One)
| x | ANNUAL REPORT PURSUANT TO SECTION 13 OR 15(d) OF THE SECURITIES EXCHANGE ACT OF 1934 For the fiscal year ended December 31, 2014 |
| OR | |
| ¨ | TRANSITION REPORT PURSUANT TO SECTION 13 OR 15(d) OF THE SECURITIES EXCHANGE ACT OF 1934 For the transition period from to |
Commission file number: 000-21467
PACIFIC ETHANOL, INC.
(Exact name of registrant as specified in its charter)
___________
Delaware |
41-2170618 |
| (State or other jurisdiction of incorporation or organization) | (I.R.S. Employer Identification No.) |
| 400 Capitol Mall, Suite 2060, Sacramento, California | 95814 |
| (Address of principal executive offices) | (Zip Code) |
Registrant’s telephone number, including area code: (916) 403-2123
Securities registered pursuant to Section 12(b) of the Act:
Title of Class |
Name of Exchange on Which Registered |
| Common Stock, $0.001 par value | The Nasdaq Stock Market LLC (Nasdaq Capital Market) |
Securities registered pursuant to Section 12(g) of the Act: None
Indicate by check mark if the registrant is a well-known seasoned issuer, as defined in Rule 405 of the Securities Act. Yes ¨ No x
Indicate by check mark if the registrant is not required to file reports pursuant to Section 13 or Section 15(d) of the Act. Yes ¨ No x
Indicate by check mark whether the registrant (1) has filed all reports required to be filed by Section 13 or 15(d) of the Securities Exchange Act of 1934 during the preceding 12 months (or for such shorter period that the registrant was required to file such reports), and (2) has been subject to such filing requirements for the past 90 days. Yes x No ¨
Indicate by check mark whether the registrant has submitted electronically and posted on its corporate Website, if any, every Interactive Data File required to be submitted and posted pursuant to Rule 405 of Regulation S-T during the preceding 12 months (or for such shorter period that the registrant was required to submit and post such files. Yes x No ¨
Indicate by check mark if disclosure of delinquent filers in response to Item 405 of Regulation S-K is not contained herein, and will not be contained, to the best of registrant’s knowledge, in definitive proxy or information statements incorporated by reference in Part III of this Form 10-K or any amendment to this Form 10-K. x
Indicate by check mark whether the registrant is a large accelerated filer, an accelerated filer, or a non-accelerated filer, or a smaller reporting company. See the definitions of “large accelerated filer,” “accelerated filer” and “smaller reporting company” in Rule 12b-2 of the Exchange Act. (Check one):
| Large accelerated filer ¨ | Accelerated filer x |
| Non-accelerated filer ¨ (Do not check if a smaller reporting company) | Smaller reporting company x |
Indicate by check mark whether the registrant is a shell company (as defined in Rule 12b-2 of the Act). Yes ¨ No x
The aggregate market value of the voting common equity held by nonaffiliates of the registrant computed by reference to the closing sale price of such stock, was approximately $315 million as of June 30, 2014, the last business day of the registrant’s most recently completed second fiscal quarter. The registrant has no non-voting common equity.
The number of shares of the registrant’s common stock, $0.001 par value, outstanding as of March 13, 2015 was 25,511,200.
DOCUMENTS INCORPORATED BY REFERENCE: None.
TABLE OF CONTENTS
PAGE
| PART I | ||
| Item 1. | Business. | 1 |
| Item 1A. | Risk Factors. | 12 |
| Item 1B. | Unresolved Staff Comments. | 26 |
| Item 2. | Properties. | 26 |
| Item 3. | Legal Proceedings. | 26 |
| Item 4. | Mine Safety Disclosures. | 27 |
| PART II | ||
| Item 5. | Market For Registrant’s Common Equity, Related Stockholder Matters and Issuer Purchases of Equity Securities. | 28 |
| Item 6. | Selected Financial Data. | 30 |
| Item 7. | Management’s Discussion and Analysis of Financial Condition and Results of Operations. | 32 |
| Item 7A. | Quantitative and Qualitative Disclosures About Market Risk. | 51 |
| Item 8. | Financial Statements and Supplementary Data. | 53 |
| Item 9. | Changes in and Disagreements With Accountants on Accounting and Financial Disclosure. | 53 |
| Item 9A. | Controls and Procedures. | 53 |
| Item 9B. | Other Information. | 54 |
| PART III | ||
| Item 10. | Directors, Executive Officers and Corporate Governance. | 55 |
| Item 11. | Executive Compensation. | 61 |
| Item 12. | Security Ownership of Certain Beneficial Owners and Management and Related Stockholder Matters. | 92 |
| Item 13. | Certain Relationships and Related Transactions, and Director Independence. | 95 |
| Item 14. | Principal Accounting Fees and Services. | 102 |
| PART IV | ||
| Item 15. | Exhibits, Financial Statement Schedules. | 103 |
| Index to Exhibits | 104 | |
| Signatures | 111 | |
| Exhibits Filed with this Report | 112 | |
CAUTIONARY STATEMENT
All statements included or incorporated by reference in this Annual Report on Form 10-K, other than statements or characterizations of historical fact, are forward-looking statements. Examples of forward-looking statements include, but are not limited to, our expectations regarding, and the effects of, our proposed merger with Aventine Renewable Energy Holdings, Inc.; statements concerning projected net sales, costs and expenses and gross margins; our accounting estimates, assumptions and judgments; the demand for ethanol and its co-products; the competitive nature of and anticipated growth in our industry; production capacity and goals; our ability to consummate acquisitions and integrate their operations successfully; and our prospective needs for additional capital. These forward-looking statements are based on our current expectations, estimates, approximations and projections about our industry and business, management’s beliefs, and certain assumptions made by us, all of which are subject to change. Forward-looking statements can often be identified by words such as “anticipates,” “expects,” “intends,” “plans,” “predicts,” “believes,” “seeks,” “estimates,” “may,” “will,” “should,” “would,” “could,” “potential,” “continue,” “ongoing,” similar expressions and variations or negatives of these words. These statements are not guarantees of future performance and are subject to risks, uncertainties and assumptions that are difficult to predict. Therefore, our actual results could differ materially and adversely from those expressed in any forward-looking statements as a result of various factors, some of which are listed under “Risk Factors” in Item 1A of this report. These forward-looking statements speak only as of the date of this report. We undertake no obligation to revise or update publicly any forward-looking statement for any reason, except as otherwise required by law.
PART I
| Item 1. | Business. |
Recent Development
Proposed Merger with Aventine Renewable Energy Holdings, Inc.
On December 30, 2014, we entered into a definitive merger agreement with Aventine Renewable Energy Holdings, Inc., or Aventine, a Midwest ethanol producer, under which we plan to acquire Aventine through a merger. The merger agreement provides that, upon the terms and subject to the conditions set forth in the merger agreement, one of our wholly-owned subsidiaries will merge with and into Aventine, with Aventine surviving as one of our wholly-owned subsidiaries. Subject to the terms and conditions of the merger agreement, which was approved by our board of directors and the board of directors of Aventine, if the merger is completed, each outstanding share of Aventine common stock will be converted into the right to receive 1.25 shares of our common stock, and we will issue approximately 17.75 million shares of our common stock to the former stockholders of Aventine. The merger is expected to result in our stockholders holding approximately 58% of the combined company.
The merger transaction, which is intended to be structured as a tax-free exchange of shares, is expected to close during the second quarter of 2015, and is subject to closing conditions, including obtaining certain regulatory approvals and approvals from the stockholders of both companies.
Business Overview
We are the leading producer and marketer of low-carbon renewable fuels in the Western United States.
We have extensive customer relationships throughout the Western United States. Our ethanol customers are integrated oil companies and gasoline marketers who blend ethanol into gasoline. These customers collectively require ethanol volumes in excess of the supply produced in the Western United States. We arrange for transportation, storage and delivery of ethanol purchased by our customers through our agreements with third-party service providers in the Western United States, as well as in the Midwest from a variety of sources. In 2014, we obtained approximately 42% of our ethanol supplies from Midwest producers to supplement ethanol produced in the Western United States, including by our four ethanol production facilities located in California, Idaho and Oregon, or the Pacific Ethanol Plants. We also market ethanol co-products, including wet distillers grains, or WDG, and corn oil for the Pacific Ethanol Plants. Our WDG customers are dairies and feedlots located near the Pacific Ethanol Plants. Our corn oil is sold to poultry and biodiesel customers. We do not market co-products from other ethanol producers.
We market all the ethanol we sell through our subsidiary, Kinergy Marketing LLC, or Kinergy. We hold a 96% ownership interest in PE Op Co., the owner of each of the plant holding companies, or the Plant Owners, that collectively own the Pacific Ethanol Plants. We operate and maintain the Pacific Ethanol Plants under the terms of an asset management agreement with the Plant Owners, and supply all goods and materials necessary to operate and maintain each Pacific Ethanol Plant.
Our ethanol customers rely on us to provide a reliable supply of product, and manage the logistics and timing of delivery with very little effort on their side. In meeting the needs of our customers, we secure supply from a variety of sources, including the Pacific Ethanol Plants, other plants in California for which we market ethanol, and suppliers in the Midwest, where a majority of ethanol manufacturers are located.
| 1 |
The Pacific Ethanol Plants are comprised of the four facilities described immediately below and have an aggregate annual production capacity of up to 200 million gallons. The facilities are near their respective fuel and feed customers, offering significant timing, transportation cost and logistical advantages.
Facility Name |
Facility Location |
Estimated
Annual Capacity | ||
| Magic Valley | Burley, ID | 60,000,000 | ||
| Columbia | Boardman, OR | 40,000,000 | ||
| Stockton | Stockton, CA | 60,000,000 | ||
| Madera | Madera, CA | 40,000,000 |
We intend to advance our position as the leading producer and marketer of low-carbon renewable fuels in the Western United States, in part by expanding our relationships with our current customers and establishing new relationships with customers outside that region. As we develop new customer relationships, we will seek new suppliers, including through the acquisition of additional production facilities. We have entered into a definitive merger agreement with Aventine, as discussed above, which we expect will add 315 million gallons of annual capacity to our existing portfolio of ethanol production assets, as well as additional supplies of co-products.
Company History
We are a Delaware corporation formed in February 2005. Our main Internet address is http://www.pacificethanol.com. Our annual reports on Form 10-K, quarterly reports on Form 10-Q, current reports on Form 8-K, amendments to those reports and other Securities and Exchange Commission filings are available free of charge through our website as soon as reasonably practicable after the reports are electronically filed with, or furnished to, the Securities and Exchange Commission. Our common stock trades on The NASDAQ Capital Market under the symbol “PEIX.” The inclusion of our Internet address in this report does not include or incorporate by reference into this report any information contained on our website.
Business Strategy
Our primary goal is to advance our position as the leading producer and marketer of low-carbon renewable fuels in the Western United States and to extend our marketing business to new regional and international markets. The key elements of our business and growth strategy to achieve this objective include:
| · | Expand ethanol production capacity and distribution infrastructure. We plan to increase our ethanol production capacity through our proposed merger with Aventine, which we plan to close in the second quarter in 2015. The merger will increase our annual ethanol production capacity by 315 million gallons. It will also increase our capacity to manufacture other co-products, and higher volumes of co-products, in addition to the array of co-products we currently produce. In addition, we plan to expand our distribution infrastructure by increasing our ability to provide transportation, storage and related logistical services to our customers throughout the Western United States. We intend to evaluate and pursue new opportunities to acquire additional ethanol production, storage and distribution facilities and related infrastructure as financial resources and business prospects make the acquisition of these facilities advisable. |
| · | Lower the carbon intensity of our ethanol. Through a number of initiatives, we continue to reduce the carbon intensity of the ethanol we produce. We are able to sell our lower carbon intensity ethanol at premium prices to ethanol with a higher carbon intensity designation. Our ability to charge premium prices is due to various programs, such as California’s Low Carbon Fuel Standard, that encourage blenders to use lower carbon intensity ethanol in their gasoline. |
| 2 |
| · | Expand and diversify co-product sales. We plan to maintain and increase sales to animal feed customers in the local markets we serve for WDG, corn oil and other co-products. We also intend to add to the array of co-products we currently manufacture. Through our proposed merger with Aventine, we will add dry distillers grains, distillers yeast, corn gluten meal, corn gluten feed and corn germ. Many of these new co-products are higher value products. |
| · | Extend our marketing business into new regional and international markets. Through our proposed merger with Aventine, we will acquire ethanol production assets in the Midwest in regions where our marketing business is already active. This will strengthen our market position in the Midwest and provide opportunities to extend our marketing business into new regional markets within reach from Aventine’s plants in Illinois and Nebraska. The Aventine merger will also open opportunities to market ethanol and co-products internationally. |
| · | Install new technologies. We intend to continue to evaluate and implement new equipment and technologies to increase the yield and efficiency of our ethanol production facilities, reduce our use of carbon-based fuels and allow us to produce advanced biofuels. |
| · | Source new feedstock. When available and cost-effective, we intend to source a variety of feedstock to produce ethanol. In 2014, in addition to corn, we used beet sugar and waste wine in our production process as an alternative to corn, and will continue to source different and potentially abundant and cost-effective feedstock, including cellulosic feedstock, to supplement corn as the raw material used in the production of ethanol. |
Competitive Strengths
We believe that our competitive strengths include the following:
| · | Our customer and supplier relationships. We have developed extensive business relationships with our customers and suppliers. In particular, we have developed extensive business relationships with major and independent un-branded gasoline suppliers who collectively control the majority of all gasoline sales in California and other Western states. In addition, we have developed extensive business relationships with ethanol and grain suppliers throughout the Western and Midwestern United States. |
| · | Our ethanol distribution network. We believe that we have a competitive advantage due to our experience in marketing to customers in major metropolitan and rural markets in the Western United States. We have developed an ethanol distribution network for delivery of ethanol by truck to virtually every significant fuel terminal as well as to numerous smaller fuel terminals throughout California and other Western states. Fuel terminals have limited storage capacity and we have successfully secured storage tanks at many of the terminals we service. In addition, we have an extensive network of third-party delivery trucks available to deliver ethanol throughout the Western United States. |
| 3 |
| · | Our operational expertise. We began managing ethanol production facilities in 2006. We believe that we have developed operational expertise and know-how that can be used to continue operating the Pacific Ethanol Plants and provide operational services to third party facilities. |
| · | Our strategic locations. We operate the Pacific Ethanol Plants in markets where we believe local characteristics create an opportunity to capture a significant production and shipping cost advantage over competing ethanol production facilities. We believe a combination of factors enable us to achieve this cost advantage, including: |
| o | Locations near fuel blending facilities lower our ethanol transportation costs while providing timing and logistical advantages over competing locations that require ethanol to be shipped over much longer distances, and in many cases, require double-handling. |
| o | Locations adjacent to major rail lines allow the efficient delivery of corn in large unit trains from major corn-producing regions, and allow for the efficient delivery of ethanol in large unit trains to other markets, including markets with higher demand. |
| o | Locations near large concentrations of dairy and/or beef cattle enable delivery of WDG over short distances without the need for costly drying processes. |
| · | Our low carbon-intensity ethanol. The California Air Resources Board has enacted a Low-Carbon Fuel Standard for transportation fuels. Oregon, Washington and British Columbia are near enacting similar programs. According to California’s Low-Carbon Fuel Standard, all of the ethanol we produce across all of our production facilities has a lower carbon-intensity than most ethanol produced at plants by other producers. This is primarily because the Pacific Ethanol Plants use less energy in their production process. The ethanol produced in California by other producers, all of which we market, also has a lower carbon-intensity rating than either gasoline or ethanol produced in the Midwest. The lower carbon-intensity rating of ethanol we produce or resell is valued in the market by our customers and has enabled us to capture premium prices for our ethanol. |
| · | Modern technologies. The Pacific Ethanol Plants use the latest production technologies to take advantage of state-of-the-art technical and operational efficiencies in order to achieve lower operating costs, higher yields and more efficient production of ethanol and its co-products and reduce our use of carbon-based fuels. |
| · | Our experienced management. Neil M. Koehler, our President and Chief Executive Officer, has over 30 years of experience in the ethanol production, sales and marketing industry. Mr. Koehler is a Director of the Renewable Fuels Association, or RFA, and is a frequent speaker on the issue of renewable fuels and ethanol marketing production and policy. In addition to Mr. Koehler, we have seasoned managers with many years of experience in the ethanol, fuel and energy industries leading our various departments. We believe that the experience of our management over the past two decades and our ethanol marketing operations have enabled us to establish valuable relationships in the ethanol industry and understand the business of producing and marketing ethanol and its co-products. |
We believe that these advantages will allow us to capture an increasing share of the total market for ethanol and its co-products.
| 4 |
Industry Overview and Market Opportunity
Overview of Ethanol Market
The primary applications for fuel-grade ethanol in the United States include:
| · | Octane enhancer. On average, regular unleaded gasoline has an octane rating of 87 and premium unleaded gasoline has an octane rating of 91. In contrast, pure ethanol has an average octane rating of 113. Adding ethanol to gasoline enables refiners to produce greater quantities of lower octane blend stock with an octane rating of less than 87 before blending. In addition, ethanol is commonly added to finished regular grade gasoline as a means of producing higher octane mid-grade and premium gasoline. |
| · | Renewable fuels. Ethanol is blended with gasoline in order to enable gasoline refiners to comply with a variety of governmental programs, in particular, the national Renewable Fuel Standard, or national RFS, which was enacted to promote alternatives to fossil fuels. See “—Governmental Regulation.” |
| · | Fuel blending. In addition to its performance and environmental benefits, ethanol is used to extend fuel supplies. In light of the need for transportation fuel in the United States and the dependence on foreign crude oil and refined products, the United States is increasingly seeking domestic sources of fuel. Much of the ethanol blending throughout the United States is done for the purpose of extending the volume of fuel sold at the gasoline pump. |
The United States ethanol industry is supported by federal and state legislation and regulation. For example, the Energy Independence and Security Act of 2007, which was signed into law in December 2007, significantly increased the prior national RFS. Under the national RFS, the mandated use of all renewable fuels rises incrementally in succeeding years and peaks at 36.0 billion gallons by 2022. Under the national RFS, approximately 13.8 billion gallons in 2013 and 14.4 billion gallons in 2014 were required from conventional, or corn-based, ethanol, which rises and peaks at 15.0 billion gallons in 2015. The national RFS allows the Environmental Protection Agency, or EPA, to adjust the annual requirement based on certain facts. The EPA has not released the Renewable Volume Obligations, or RVO, for 2014 and has not issued a draft proposal for 2015. The EPA has indicated that its previous 2014 draft proposal for a total of 15.2 billion gallons for all renewable fuels, including 13.0 billion gallons for conventional renewable fuels in 2014, will not be the final regulation and that it expects to issue a final RVO for 2014 in the second quarter of 2015. Despite the current uncertainty from the EPA, we believe that the national RFS will continue to provide long-term support for increasing the demand for ethanol and other biofuels.
According to the U.S. Energy Information Administration, the domestic ethanol industry produced approximately 14.2 billion gallons of ethanol in 2014. We believe that the ethanol market in California alone represented approximately 10% of the national market. However, the Western United States has relatively few ethanol facilities and local ethanol production levels are substantially below the local demand for ethanol. The balance of ethanol is shipped via rail from the Midwest to the Western United States. Gasoline and diesel fuel that supply the major fuel terminals are shipped in pipelines throughout portions of the Western United States. Unlike gasoline and diesel fuel, however, ethanol is not shipped in these types of pipelines because ethanol has an affinity for mixing with water already present in the pipelines. When mixed, water dilutes ethanol and creates significant quality control issues. Therefore, ethanol must be trucked from rail terminals to regional fuel terminals, or blending racks. Ethanol prices in the Western United States have typically been $0.20 per gallon higher than in the Midwest due to the freight costs of delivering ethanol from Midwest production facilities. For 2014, however, ethanol prices in the Western United States averaged $0.32 per gallon higher than ethanol prices in the Midwest due to rail logistics challenges and weather conditions during the winter which constrained the flow of ethanol and co-products from the Midwest to the markets in which we operate.
| 5 |
We believe that approximately 90% of the ethanol produced in the United States is made in the Midwest from corn. According to the Department of Energy, or DOE, ethanol is generally blended at a rate of 10% by volume, but is also blended at a rate of up to 85% by volume for vehicles designed to operate on 85% ethanol. The EPA has increased the allowable blend of ethanol in gasoline from 10% by volume to 15% by volume for model year 2001 and newer automobiles, pending final approvals by certain state regulatory authorities. Some retailers have begun blending at higher rates in states that have approved higher blend rates.
Compared to gasoline, ethanol is generally considered to be cleaner burning and contains higher octane. We anticipate that the increasing demand for renewable transportation fuels coupled with limited opportunities for gasoline refinery expansions and the growing importance of reducing CO2 emissions through the use of renewable fuels will generate additional growth in the demand for ethanol in the Western United States.
According to the DOE, total annual gasoline consumption in the United States is approximately 136 billion gallons and total annual ethanol consumption represented approximately 10% of this amount in 2014. The domestic ethanol industry has substantially reached the initial 10% blend ratio, and we believe the industry has significant potential for growth as the industry migrates to an up to 15% blend ratio, which equals an annual demand of between 13.4 billion and 20.1 billion gallons of ethanol. Furthermore, the national RFS requires an increase of up to 36.0 billion gallons of ethanol annually by 2022, subject to an annual EPA review to adjust targets based on availability of commercially produced advanced and cellulose biofuels.
Overview of Ethanol Production Process
The production of ethanol from starch- or sugar-based feedstock has been refined considerably in recent years, leading to a highly-efficient process that we believe now yields substantially more energy from ethanol and its co-products than is required to make the products. The modern production of ethanol requires large amounts of corn, or other high-starch grains, and water as well as chemicals, enzymes and yeast, and denaturants including unleaded gasoline or liquid natural gas, in addition to natural gas and electricity.
In the dry milling process, corn or other high-starch grains are first ground into meal and then slurried with water to form a mash. Enzymes are then added to the mash to convert the starch into the simple sugar, dextrose. Ammonia is also added for acidic (pH) control and as a nutrient for the yeast. The mash is processed through a high temperature cooking procedure, which reduces bacteria levels prior to fermentation. The mash is then cooled and transferred to fermenters, where yeast is added and the conversion of sugar to ethanol and CO2 begins.
After fermentation, the resulting “beer” is transferred to distillation, where the ethanol is separated from the residual “stillage.” The ethanol is concentrated to 190 proof using conventional distillation methods and then is dehydrated to approximately 200 proof, representing 100% alcohol levels, in a molecular sieve system. The resulting anhydrous ethanol is then blended with about 2.5% denaturant, which is usually gasoline, and is then ready for shipment to market.
The residual stillage is separated into a coarse grain portion and a liquid portion through a centrifugation process. The soluble liquid portion is concentrated to about 40% dissolved solids by an evaporation process. This intermediate state is called condensed distillers solubles, or syrup. The coarse grain and syrup portions are then mixed to produce WDG or can be mixed and dried to produce dried distillers grain with solubles. Both WDG and DDGS are high-protein animal feed products.
| 6 |
Overview of Distillers Grains Market
Most distillers grains are produced in the Midwest, where producers dry the grains before shipping in order to lower their shipping costs and extend the life of the product. Successful and profitable delivery of DDGS from the Midwest to markets in the Western United States faces a number of challenges, including drying of distiller grains which may increase the energy cost to dry the grains and reduce the quality of the feed product, and longer distance to market, which may increase the handling and transportation costs to deliver the grains to market. By not drying the distillers grains and by shipping WDG locally, we believe that we will be able to better preserve the feed value of this product, as the WDG retains a higher percentage of nutrients than DDGS.
Historically, the market price for distillers grains has generally tracked the value of corn. We believe that the market price of DDGS is determined by a number of factors, including the market value of corn, soybean meal and other competitive ingredients, the performance or value of DDGS in a particular feed formulation and general market forces of supply and demand, including export markets for these co-products. The market price of distillers grains is also often influenced by nutritional models that calculate the feed value of distillers grains by nutritional content, as well as reliability of consistent supply.
Customers
We market and sell through Kinergy all of the ethanol produced by the Pacific Ethanol Plants and ethanol produced by other third-parties. We have extensive customer relationships throughout the Western United States. Our ethanol customers are integrated oil companies and gasoline marketers who blend ethanol into gasoline. These customers collectively require ethanol volumes in excess of the supply produced in the Western United States. We arrange for transportation, storage and delivery of ethanol purchased by our customers through our agreements with third-party service providers in the Western United States and the Midwest from a variety of sources. In addition, we sell WDG and corn oil produced by the Pacific Ethanol Plants to customers comprised of dairies, feedlots and poultry and biodiesel customers located near the Pacific Ethanol Plants. We do not market co-products from other ethanol producers.
We generated $987.9 million, $781.7 million and $699.5 million in net sales for the years ended December 31, 2014, 2013, and 2012, respectively, from the sale of ethanol. We generated $111.5 million, $118.7 million and $110.7 million in net sales for the years ended December 31, 2014, 2013, and 2012, respectively, from the sale of co-products.
During 2014, 2013 and 2012, we produced or purchased ethanol from third parties and resold an aggregate of approximately 400 million, 302 million and 285 million gallons of fuel-grade ethanol to approximately 41, 37 and 52 customers, respectively. Sales to our four largest customers, Chevron Products USA, Valero Energy Corporation, Sinclair Oil Corporation and Tesoro Refining and Marketing Company LLC in 2014, 2013 and 2012 represented an aggregate of approximately 59%, 58% and 51%, of our net sales, respectively. Sales to each of our other customers represented less than 10% of our net sales in each of 2014, 2013 and 2012.
Most of the largest metropolitan areas in the Western United States have fuel terminals served by rail, but other major metropolitan areas and more remote smaller cities and rural areas do not. We believe that we have a competitive advantage due to our experience in marketing to the segment of customers in major metropolitan and rural markets in the Western United States. We manage the complicated logistics of shipping ethanol purchased from third-parties from the Midwest by rail to intermediate storage locations throughout the Western United States and trucking the ethanol from these storage locations to blending racks where the ethanol is blended with gasoline. We believe that by establishing an efficient service for truck deliveries to these more remote locations, we have differentiated ourselves from our competitors. In addition, by producing ethanol in the Western United States, we believe that we will benefit from our ability to increase spot sales of ethanol from this additional supply following ethanol price spikes caused from time to time by rail delays in delivering ethanol from the Midwest to the Western United States. In addition to producing ethanol, we produce ethanol co-products, including WDG. We endeavor to position WDG as the protein feed of choice for cattle based on its nutritional composition, consistency of quality and delivery, ease of handling and its mixing ability with other feed ingredients. We are one of the few WDG producers with production facilities located in the Western United States and we primarily sell our WDG to dairy farmers in close proximity to the Pacific Ethanol Plants.
| 7 |
Suppliers
Our marketing operations are dependent upon various third-party producers of fuel-grade ethanol. In addition, we provide ethanol transportation, storage and delivery services through third-party service providers with whom we have contracted to receive ethanol at agreed upon locations from our suppliers and to store and/or deliver the ethanol to agreed-upon locations on behalf of our customers. These contracts generally run from year-to-year, subject to termination by either party upon advance written notice before the end of the then current annual term.
During 2014, 2013 and 2012, we purchased fuel-grade ethanol and corn, the largest component in producing ethanol, from our suppliers. Purchases from our three largest suppliers represented an aggregate of approximately 53%, 59% and 64% of our total ethanol and corn purchases for 2014, 2013 and 2012, respectively. Purchases from each of our other suppliers represented less than 10% of total ethanol and corn purchases in each of 2014, 2013 and 2012. In 2014, we obtained 42% of our ethanol supplies from Midwest producers to supplement production in the Western United States.
The ethanol production operations of the Pacific Ethanol Plants are dependent upon various raw materials suppliers, including suppliers of corn, natural gas, electricity and water. The cost of corn is the most important variable cost associated with the production of ethanol. An ethanol facility must be able to efficiently ship corn from the Midwest via rail and cheaply and reliably truck ethanol to local markets. We source corn for the Pacific Ethanol Plants using standard contracts, including spot purchase, forward purchase and basis contracts. When resources are available to do so, we seek to limit the exposure of the Pacific Ethanol Plants to raw material price fluctuations by purchasing forward a portion of their corn requirements on a fixed price basis and by purchasing corn and other raw materials futures contracts.
Pacific Ethanol Plants
The table below provides an overview of the Pacific Ethanol Plants owned by PE Op Co. and operated by us. We hold a 96% ownership interest in PE Op Co. The Pacific Ethanol Plants have an aggregate annual production capacity of up to 200 million gallons. The facilities are near their respective fuel and feed customers, offering significant timing, transportation cost and logistical advantages.
All of the Pacific Ethanol Plants are operational. As market conditions change, we may increase, decrease or idle production at one or more operational facilities or resume operations at any idled facility.
Madera |
Columbia |
Magic
Valley |
Stockton | |||||
| Location | Madera, CA | Boardman, OR | Burley, ID | Stockton, CA | ||||
| Approximate maximum annual ethanol production capacity (in millions of gallons) | 40 | 40 | 60 | 60 | ||||
| Ownership by PE Op Co. | 100% | 100% | 100% | 100% | ||||
| Primary energy source | Natural Gas | Natural Gas | Natural Gas | Natural Gas | ||||
| Estimated annual WDG production capacity (in thousands of tons) | 293 | 293 | 418 | 418 |
We operate and maintain the Pacific Ethanol Plants under the terms of an asset management agreement with the Plant Owners, and supply all goods and materials necessary to operate and maintain each Pacific Ethanol Plant.
| 8 |
Commodity Risk Management
We employ various risk mitigation techniques. For example, we may seek to mitigate our exposure to commodity price fluctuations by purchasing forward a portion of our corn and natural gas requirements through fixed-price or variable-price contracts with our suppliers, as well as entering into derivative contracts for ethanol, corn and natural gas. To mitigate ethanol inventory price risks, we may sell a portion of our production forward under fixed- or index-price contracts, or both. We may hedge a portion of the price risks by selling exchange-traded futures contracts. Proper execution of these risk mitigation strategies can reduce the volatility of our gross profit margins. However, given the nature of our business, we cannot effectively hedge against extreme volatility or certain market conditions. For example, ethanol prices, as reported by the Chicago Board of Trade, or CBOT, ranged from $1.50 to $3.52 per gallon during 2014 and corn prices, as reported by the CBOT, ranged from $3.21 to $5.16 per bushel during 2014.
Marketing Arrangements
In addition to our marketing agreements with the Plant Owners to market all of the ethanol produced at the Pacific Ethanol Plants, we have exclusive ethanol marketing agreements with third-party ethanol producers, including Calgren Renewable Fuels, LLC and AE Advanced Fuels Keyes, Inc. to market and sell their entire ethanol production volumes. Calgren Renewable Fuels, LLC owns and operates an ethanol production facility in Pixley, California with annual production capacity of 55 million gallons. AE Advanced Fuels Keyes, Inc. owns and operates an ethanol production facility in Keyes, California with annual production capacity of 55 million gallons. We intend to evaluate and pursue opportunities to enter into marketing arrangements with other ethanol producers as business prospects make these marketing arrangements advisable.
Competition
We operate in the highly competitive ethanol production and marketing industry. The largest ethanol producers in the United States are Archer Daniels Midland Company and Valero Energy Corporation, collectively with over 20% of the total installed capacity of ethanol in the United States. In addition, there are many mid-size producers with several plants under ownership, smaller producers with one or two plants, and several ethanol marketers that create significant competition. Overall, we believe there are over 200 ethanol facilities in the United States with a total installed operating capacity of approximately 15 billion gallons and many brokers and marketers with whom we compete for sales of ethanol and its co-products.
We believe that our competitive strengths include our strategic locations in the Western United States, our extensive ethanol distribution network, our extensive customer and supplier relationships, our use of modern technologies at our production facilities and our experienced management. We believe that these advantages will allow us to capture an increasing share of the total market for ethanol and its co-products and earn favorable margins on ethanol and its co-products that we produce.
Our strategic focus on particular geographic locations designed to capitalize on cost efficiencies may nevertheless result in higher than expected costs as a result of more expensive raw materials and related shipping costs, including corn, which generally must be transported from the Midwest. If the costs of producing and shipping ethanol and its co-products over short distances are not advantageous relative to the costs of obtaining raw materials from the Midwest, then the planned benefits of our strategic locations may not be realized.
| 9 |
Governmental Regulation
Our business is subject to federal, state and local laws and regulations relating to the production of renewable fuels, the protection of the environment and in support of the corn and ethanol industries. These laws, their underlying regulatory requirements and their enforcement, some of which are described below, impact, or may impact, our existing and proposed business operations by imposing:
| · | restrictions on our existing and proposed business operations and/or the need to install enhanced or additional controls; |
| · | the need to obtain and comply with permits and authorizations; |
| · | liability for exceeding applicable permit limits or legal requirements, in some cases for the remediation of contaminated soil and groundwater at our facilities, contiguous and adjacent properties and other properties owned and/or operated by third parties; and |
| · | specifications for the ethanol we market and produce. |
In addition, some governmental regulations are helpful to our ethanol production and marketing business. The ethanol fuel industry is greatly dependent upon mandates and environmental regulations that favor the use of ethanol in motor fuel blends in North America. Some of the governmental regulations applicable to our ethanol production and marketing business are briefly described below.
National Energy Legislation
The Energy Independence and Security Act of 2007, which was signed into law in December 2007, significantly increased the prior national RFS. The national RFS significantly increases the mandated use of renewable fuels, rising incrementally each year, to 36.0 billion gallons by 2022.
Under the provisions of the Energy Independence and Security Act of 2007, the EPA has the authority to waive the mandated national RFS requirements in whole or in part. To grant the waiver, the EPA administrator must determine, in consultation with the Secretaries of Agriculture and Energy, that there is inadequate domestic renewable fuel supply or implementation of the requirement would severely harm the economy or environment of a state, region or the United States.
The EPA has not released the RVO for 2014 and has not issued a draft proposal for 2015. The EPA has indicated that its previous 2014 draft proposal for a total of 15.2 billion gallons for all renewable fuels, including 13.0 billion gallons for conventional renewable fuels in 2014, will not be the final regulation and that it expects to issue the final RVO for 2014 in the second quarter of 2015. Despite the current uncertainty from the EPA, we believe that the national RFS will continue to provide long-term support for increasing the demand for ethanol and other biofuels.
Legislation aimed at reducing or eliminating the renewable fuel use required by the national RFS has been introduced in the United States Congress. On February 4, 2015, the RFS Elimination Act (H.R. 703) was introduced in the House of Representatives. The bill would fully repeal the national RFS. Also introduced on February 4, 2015, was the RFS Reform Act (H.R. 704), which prohibits corn-based ethanol from meeting the national RFS requirements, caps the amount of ethanol that can be blended into conventional gasoline at 10%, and requires the EPA to set requirements for cellulosic biofuels at actual production levels. On February 3, 2015, a bill (H.R. 21) was introduced in the House of Representatives to vacate the waiver issued by EPA allowing the use of 15% ethanol blends in certain light-duty vehicles. On February 26, 2015, the Corn Ethanol Mandate Elimination Act of 2015 was introduced in the Senate. The bill would eliminate corn ethanol as qualifying as a renewable fuel under the national RFS. All of these bills were assigned to a congressional committee, which will consider them before possibly sending any of them on to the House of Representatives or the Senate as a whole.
| 10 |
E15 (a Blend of Gasoline and Ethanol)
The EPA has allowed fuel and fuel-additive manufacturers to introduce into commercial gasoline that contains greater than 10% ethanol by volume, up to 15% ethanol by volume, or E15, for vehicles from model year 2001 and beyond. Additional changes to some states’ laws to allow for the use of E15 are still required, however, commercial sale of E15 has begun in some states.
State Energy Legislation and Regulations
In January 2007, California’s Governor signed an executive order directing the California Air Resources Board to implement California’s Low-Carbon Fuel Standard for transportation fuels. California’s Low-Carbon Fuel Standard requires fuel suppliers to reduce the carbon intensity of transportation fuels to 10% below 2010 levels by 2020. The Governor’s office estimates that the standard will have the effect of increasing current renewable fuels use in California by three to five times by 2020.
Over the past year, the California Air Resources Board has engaged in a comprehensive process to re-adopt California’s Low-Carbon Fuel Standard for transportation fuels through 2030 and to apply aggressive new carbon intensity reduction targets for the final 10 years. In early March 2015, the California Air Resources Board staff held a public hearing on the proposed final rule. We expect formal approval of the rule during the summer of 2015 and expect the revised program to begin January 1, 2016. We believe the revised program will be beneficial as we produce among the lowest carbon intensity ethanol commercially available, and we receive a premium for the fuel we sell into the California marketplace, which we expect will increase as the compliance curve steepens beginning in 2016.
California’s Low-Carbon Fuel Standard has also resulted in similar regulations in the neighboring states of Oregon and Washington, and into the Canadian province of British Columbia. These regions, together with California, represent a very large segment of the overall demand for transportation fuels in the United States.
Additional Environmental Regulations
In addition to the governmental regulations applicable to the ethanol production and marketing industry described above, our business is subject to additional federal, state and local environmental regulations, including regulations established by the EPA, the San Joaquin Valley Regional Water Quality Control Board, the San Joaquin Valley Air Pollution Control District and the California Air Resources Board. We cannot predict the manner or extent to which these regulations will harm or help our business or the ethanol production and marketing industry in general.
Employees
As of March 13, 2015, we had approximately 180 full-time employees. We believe that our employees are highly-skilled, and our success will depend in part upon our ability to retain our employees and attract new qualified employees, many of whom are in great demand. We have never had a work stoppage or strike, and no employees are presently represented by a labor union or covered by a collective bargaining agreement. We consider our relations with our employees to be good.
| 11 |
| Item 1A. | Risk Factors. |
Before deciding to purchase, hold or sell our common stock, you should carefully consider the risks described below in addition to the other information contained in this Report and in our other filings with the Securities and Exchange Commission, including subsequent reports on Forms 10-Q and 8-K. The risks and uncertainties described below are not the only ones we face. Additional risks and uncertainties not presently known to us or that we currently deem immaterial may also affect our business. If any of these known or unknown risks or uncertainties actually occurs with material adverse effects on Pacific Ethanol, our business, financial condition, results of operations and/or liquidity could be seriously harmed. In that event, the market price for our common stock will likely decline, and you may lose all or part of your investment.
Risks Related to the Merger with Aventine
The pendency of the merger with Aventine could have an adverse effect on the price of our common stock, business, financial condition, results of operations or business prospects.
While we are not aware of any significant adverse effects to date, the pendency of the merger with Aventine could disrupt our business in the following ways, among others:
| · | our customers and other third-party business partners may seek to terminate and/or renegotiate their relationships with us as a result of the merger, whether pursuant to the terms of their existing agreements with us or otherwise; |
| · | the attention of our management may be directed toward the completion of the merger and related matters and may be diverted from our day-to-day business operations, including from other opportunities that might otherwise be beneficial to us; and |
| · | current and prospective employees may experience uncertainty regarding their future roles with the combined company, which might adversely affect our ability to retain, recruit and motivate key personnel. |
Should they occur, any of these matters could adversely affect our stock price, or harm our financial condition, results of operations or business prospects.
Failure to complete the merger could adversely affect our stock price and future business and financial results.
Completion of the merger is subject to a number of conditions, including among other things, the receipt of approval of the Pacific Ethanol and Aventine stockholders. There is no assurance that the parties will receive the necessary approvals or satisfy the other conditions to the completion of the merger, including, among others, the condition that our volume-weighted average closing price per share for the 20 trading days immediately preceding the closing of the merger must equal or exceed $10.00. Failure to complete the proposed merger will prevent us and Aventine from realizing the anticipated benefits of the merger. We will also remain liable for significant transaction costs, including legal, accounting and financial advisory fees, unless provided otherwise by the merger agreement. In addition, the market price of our common stock may reflect various market assumptions as to whether the merger will occur. Consequently, the failure to complete the merger could result in a significant change in the market price of our common stock.
Obtaining required approvals necessary to satisfy the conditions to the completion of the merger may delay or prevent completion of the merger.
To complete the merger, our stockholders must approve the issuance of shares of our common stock and non-voting common stock and the amendment of our Certificate of Incorporation and holders of at least 66-2/3% of our Series B Cumulative Redeemable Convertible Preferred Stock, or Series B Preferred Stock, must agree not to treat the merger as a liquidation, dissolution or winding up within the meaning of the Series B Certificate of Designations, each as contemplated by the merger agreement, and Aventine stockholders must adopt the merger agreement and approve the merger. In addition, the completion of the merger is conditioned upon the receipt of certain governmental authorizations, consents, orders or other approvals. On February 18, 2014, the Federal Trade Commission granted early termination of the waiting period under the Hart-Scott-Rodino Act. Pacific Ethanol and Aventine intend to pursue all required approvals in accordance with the merger agreement. No assurance can be given that the required approvals will be obtained and, even if all such approvals are obtained, no assurance can be given as to the terms, conditions and timing of the approvals or that they will satisfy the terms of the merger agreement.
Termination of the merger agreement could negatively impact us.
If the merger agreement is terminated, there may be various consequences. For example, our business may be impacted adversely by the failure to pursue other beneficial opportunities due to the focus of management on the merger, without realizing any of the anticipated benefits of completing the merger. Additionally, if the merger agreement is terminated, the market price of our common stock could decline to the extent that the current market prices reflect a market assumption that the merger will be completed. If the merger agreement is terminated under certain circumstances, we may be required to pay to Aventine a termination fee of $5,982,000 or an expense reimbursement amount of up to $1,994,000.
| 12 |
The market price of our common stock after the merger may be affected by factors different from those currently affecting our shares.
Upon completion of the merger, holders of Aventine common stock will become holders of our common stock and/or non-voting common stock. Our business differs in important respects from that of Aventine, and, accordingly, the results of operations of the combined company and the market price of our common stock after the completion of the merger may be affected by factors different from those currently affecting our operations.
The issuance of shares of our common stock to Aventine stockholders in the merger will substantially dilute the interest in Pacific Ethanol held by our stockholders prior to the merger.
If the merger is completed, it is estimated that we will issue up to approximately 17,755,300 shares of our common stock and non-voting common stock upon the closing of the merger, assuming no exercise or conversion of outstanding options and warrants. Based on the number of shares of Pacific Ethanol and Aventine common stock issued and outstanding on the Pacific Ethanol and Aventine record dates, Aventine stockholders before the merger will own, in the aggregate, approximately 42% of the aggregate number of shares of our common stock and non-voting common stock issued and outstanding immediately after the merger. The issuance of shares of our common stock and/or non-voting common stock to Aventine stockholders in the merger will cause a 42% reduction in the relative percentage interest of our current stockholders in the earnings, voting rights, liquidation value and book and market value of Pacific Ethanol. It is expected that Pacific Ethanol stockholders before the merger will hold approximately 58% of the total Pacific Ethanol common stock and non-voting common stock issued and outstanding immediately following the completion of the merger. In other words, Pacific Ethanol’s stockholders before the merger will experience dilution in the amount of 42% as a result of the merger.
Risks Related to the Combined Company if the Merger is Completed
The failure to successfully integrate the businesses of Pacific Ethanol and Aventine in the expected timeframe would adversely affect the combined company’s future results following the completion of the merger.
The success of the merger will depend, in large part, on the ability of the combined company following the completion of the merger to realize the anticipated benefits from combining our business with the business of Aventine. To realize these anticipated benefits, the combined company must successfully integrate the businesses of Pacific Ethanol and Aventine. This integration will be complex and time-consuming.
The failure to integrate successfully and to manage successfully the challenges presented by the integration process may result in the combined company’s failure to achieve some or all of the anticipated benefits of the merger.
Potential difficulties that may be encountered in the integration process include the following:
| · | lost sales and customers as a result of customers of either of the two companies deciding not to do business with the combined company; |
| · | complexities associated with managing the larger, more complex, combined business; |
| · | integrating personnel from the two companies; |
| · | potential unknown liabilities and unforeseen expenses, delays or regulatory conditions associated with the merger; and |
| · | performance shortfalls at one or both of the companies as a result of the diversion of management’s attention caused by completing the merger and integrating the companies’ operations. |
The combined company’s future results will suffer if the combined company does not effectively manage its expanded operations following the merger.
Following the merger, the size of the combined company’s business will be significantly larger than the current businesses of Pacific Ethanol and Aventine. The combined company’s future success depends, in part, upon its ability to manage this expanded business, which will pose substantial challenges for the combined company’s management, including challenges related to the management and monitoring of new operations and associated increased costs and complexity. Neither we nor Aventine can assure you that the combined company will be successful or that the combined company will realize the expected operating efficiencies, annual net operating synergies, revenue enhancements and other benefits currently anticipated to result from the merger.
Aventine is currently engaged in litigation regarding its Aurora West Facility located in Aurora, Nebraska.
Among other legal claims, the Aurora Coop has filed legal claims against Aventine asserting that it has the right, pursuant to an agreement between Aventine and the Aurora Coop, dated March 23, 2010, to exercise an option to acquire the 84 acres of land upon which the Aurora West Facility is located, together with the Aurora West Facility and all related improvements, for a purchase price of $16,500 per acre (approximately $1,386,000). The Aurora Coop asserts that its contractual right to exercise this option arose on July 1, 2012 due to Aventine’s alleged failure to complete construction of the Aurora West Facility as of such date. The Aurora Coop asserts that it has the right to take title to the land on which the Aurora West Facility is located and all improvements thereon, including the Aurora West Facility. Aventine disputes the allegations and claims asserted by the Aurora Coop, and Aventine denies the validity and effectiveness of the Aurora Coop’s exercise of its option to purchase the land on which the Aurora West Facility is located. Aventine has asserted in its legal filings that it has satisfied its contractual obligations with respect to the completion of the plant as of the required date. Aventine has advised that it will continue to vigorously defend against any assertion that the Aurora Coop has any right to repurchase the land or any improvements on the land. The action is currently pending in the United States District Court, Nebraska (Case No. 4:12 cv 0230). If Aventine is unsuccessful in defending this litigation, a number of outcomes may occur, including, without limitation, the conveyance of the land on which the Aurora West Facility is located (together with the Aurora West Facility and all related improvements) to the Aurora Coop for a purchase price that is substantially below the fair market value of the land and the facility, which Aventine believes would be an inequitable resolution of this claim, together with an unspecified amount of damages to the Aurora Coop related to the income the Aurora Coop alleges that it could have generated if the land had been conveyed as of an earlier date. An adverse outcome in Aventine’s defense of this litigation, could materially adversely affect Aventine’s business, financial condition, and results of operations.
Aventine is attempting to establish a rail connection in conjunction with the Burlington Northern Santa Fe Railroad Company.
Aventine has advised that it is using its commercially reasonable efforts to complete all necessary arrangements, including engineering, design and contracting with the Burlington Northern Santa Fe Railroad Company, or BNSF, as promptly as practicable, in order to establish a new connection through the rail facilities of its subsidiary, Nebraska Energy, L.L.C., or NELLC, to the inner rail loop track belonging to Aventine’s Aurora West Facility along with the associated “diamond switch” crossing the outer rail loop, along a path that lies entirely on land owned by NELLC or Aventine’s subsidiary, Aventine Renewable Energy – Aurora West, LLC, such that the Aurora West Facility will be able to ship ethanol by rail in unit trains and single cars. However, there are no guarantees that Aventine will be able to complete the rail connection on a certain schedule (or at all). If such connection is not obtained it could have a material adverse effect on the combined company’s future results following the completion of the merger.
An affiliate of Aventine is currently engaged in a dispute in connection its prior storage surplus beet sugar and amounts owed by such affiliate.
In 2013, Aventine Renewable Energy, Inc., a wholly owned affiliate of Aventine, or ARE, Inc., purchased surplus beet sugar through a U.S. Department of Agriculture program for Aventine’s operations. The Western Sugar Cooperative, or Western Sugar, among other entities, warehoused this surplus sugar. ARE, Inc. paid for the warehousing of this sugar from inception of the relationship. Western Sugar, however, subsequently asserted that certain penalty rates for the storage of this product should have applied despite the lack of an agreement to such rates by ARE, Inc. Aventine and ARE, Inc. had been attempting to resolve the matter short of formal litigation when, on February 27, 2015, Western Sugar filed an action in the United States District Court, District of Colorado, seeking payment of the penalty storage fees as “expectation damages,” in the amount of approximately $8.6 million. Aventine considers these claims to be without merit and will aggressively defend against them. ARE, Inc. and Aventine’s inability to successfully defend this matter could have a material adverse effect on the combined company’s future results following the completion of the merger.
| 13 |
The loss of key personnel could have a material adverse effect on the combined company’s business, financial condition or results of operations after the merger.
The success of the merger will depend in part on the combined company’s ability to retain key Pacific Ethanol and Aventine employees who continue employment with the combined company after the merger is completed. It is possible that these employees might decide not to remain with the combined company after the merger is completed. If these key employees terminate their employment, the combined company’s business activities might be adversely affected, management’s attention might be diverted from integrating Pacific Ethanol and Aventine to recruiting suitable replacements and the combined company’s business, financial condition or results of operations could be adversely affected. In addition, the combined company might not be able to locate suitable replacements for any such key employees who leave the combined company or offer employment to potential replacements on reasonable terms.
The success of the combined company will also depend on relationships with third parties and pre-existing customers of Pacific Ethanol and Aventine, which relationships may be affected by customer preferences or public attitudes about the merger. Any adverse changes in these relationships could adversely affect the combined company’s business, financial condition or results of operations.
The combined company’s success will depend on the ability to maintain and renew business relationships, including relationships with pre-existing customers of both Pacific Ethanol and Aventine, and to establish new business relationships. There can be no assurance that the business of the combined company will be able to maintain pre-existing customer contracts and other business relationships, or enter into or maintain new customer contracts and other business relationships, on acceptable terms, if at all. The failure to maintain important business relationships could have a material adverse effect on the business, financial condition or results of operations of the combined company.
The combined company will incur significant transaction and merger-related costs in connection with the merger.
Pacific Ethanol and Aventine expect to incur significant costs associated with completing the merger and combining the operations of the two companies. The exact magnitude of these costs is not yet known. In addition, there may be unanticipated costs associated with the integration. Although Pacific Ethanol and Aventine expect that the elimination of duplicative costs and other efficiencies may offset incremental transaction and merger-related costs over time, these benefits may not be achieved in the near term or at all.
The combined company will record goodwill that could become impaired and adversely affect the combined company’s operating results.
The merger will be accounted for as an acquisition by Pacific Ethanol in accordance with accounting principles generally accepted in the United States. Under the acquisition method of accounting, the assets and liabilities of Aventine will be recorded, as of completion, at their respective fair values and added to ours. The reported financial condition and results of operations of Pacific Ethanol issued after completion of the merger will reflect Aventine balances and results after completion of the merger, but will not be restated retroactively to reflect the historical financial position or results of operations of Aventine for periods prior to the merger. Following completion of the merger, the earnings of the combined company will reflect acquisition accounting adjustments.
Under the acquisition method of accounting, the total purchase price will be allocated to Aventine’s tangible assets and liabilities and identifiable intangible assets based on their fair values as of the date of completion of the merger. The excess of the purchase price over those fair values will be recorded as goodwill. The merger may result in the creation of goodwill based upon the application of the acquisition method of accounting. To the extent the value of goodwill or intangibles becomes impaired, the combined company may incur material charges relating to such impairment. Such a potential impairment charge could have a material impact on the combined company’s operating results.
| 14 |
The combined company’s indebtedness following the merger will be greater than Pacific Ethanol’s existing indebtedness. Therefore, it may be more difficult for the combined company to pay or refinance its debts and the combined company may need to divert its cash flow from operations to debt service payments. The additional indebtedness could limit the combined company’s ability to pursue other strategic opportunities and increase its vulnerability to adverse economic and industry conditions.
In connection with the merger, the combined company will also be responsible for Aventine’s outstanding debt. Our total indebtedness as of December 31, 2014 was approximately $34.5 million. Our pro forma total consolidated indebtedness as of December 31, 2014, after giving effect to the merger, would have been approximately $195.5 million (all of which would be non-current). The combined company’s debt service obligations with respect to this increased indebtedness could have a material adverse impact on its earnings and cash flows, which after the merger would include the earnings and cash flows of Aventine, for as long as the indebtedness is outstanding.
The combined company’s increased indebtedness could also have important consequences to holders of our common stock. For example, it could:
| · | make it more difficult for the combined company to pay or refinance its debts as they become due during adverse economic and industry conditions because any decrease in revenues could cause the combined company to not have sufficient cash flows from operations to make its scheduled debt payments; |
| · | limit the combined company’s flexibility to pursue other strategic opportunities or react to changes in its business and the industry in which it operates and, consequently, place the combined company at a competitive disadvantage to its competitors with less debt; or |
| · | require a substantial portion of the combined company’s cash flows from operations to be used for debt service payments, thereby reducing the availability of its cash flow to fund working capital, capital expenditures, acquisitions, dividend payments and other general corporate purposes. |
Based upon current levels of operations, we expect the combined company to be able to generate sufficient cash on a consolidated basis to make all of the principal and interest payments when such payments are due under its existing credit facilities, indentures and other instruments governing their outstanding indebtedness, and the indebtedness of Aventine that may remain outstanding after the merger, but there can be no assurance that the combined company will be able to repay or refinance such borrowings and obligations.
| 15 |
The merger may not be accretive, and may be dilutive, to our earnings per share, which may negatively affect the market price of our common stock.
Although the merger is expected to be accretive to earnings per share, the merger may not be accretive, and may be dilutive, to our earnings per share. The expectation that the merger will be accretive is based on preliminary estimates that may materially change. All of the risk factors applicable to the ethanol industry and our business as a marketer and producer of ethanol are also be applicable to Aventine’s business and will be applicable to the combined company after the merger. In addition, future events and conditions could decrease or delay any accretion, result in dilution or cause greater dilution than may be expected, including:
| · | adverse changes in market conditions; |
| · | commodity prices for corn, ethanol, gasoline and crude oil; |
| · | production levels; |
| · | operating results; |
| · | competitive conditions; |
| · | laws and regulations affecting the ethanol business; |
| · | capital expenditure obligations; and |
| · | general economic conditions. |
Any dilution of, or decrease or delay of any accretion to, our earnings per share could cause the price of our common stock to decline.
Business issues currently faced by one company may be imputed to the operations of the other company or the combined company.
To the extent that either we or Aventine currently has or is perceived by customers to have operational challenges, those challenges may raise concerns by existing customers of the other company following the merger which may limit or impede our future ability to maintain relationships with those customers.
Resales of shares of our common stock to be issued upon closing of the merger, or a perception that a substantial number of such shares merger will be resold into the market, may cause the market price of our common stock and the value of your investment to decline significantly.
We currently estimate that we will issue up to an aggregate of approximately 17,755,300 shares of our common stock and non-voting common stock upon the closing of the merger, assuming no exercise or conversion of Aventine’s outstanding options and warrants. A majority of the newly issued shares are subject to stockholders agreements entered into by us and certain stockholders of Aventine prohibiting the sale of our shares issued in connection with the merger for various periods of time. The issuance of these new shares of our common stock and non-voting common stock, and the sale of these new shares of common stock (including shares of common stock issuable upon conversion of shares of non-voting common stock issued in the merger) by current Aventine stockholders (i) after the merger, for those Aventine stockholders not subject to the stockholders agreements, or (ii) after applicable restrictive periods have passed for those Aventine stockholders subject to the stockholders agreements, or the perception that these sales could occur, could have the effect of depressing the market price for shares of our common stock. In addition, the issuance of shares of our common stock upon exercise of our outstanding options and warrants or upon conversion of our Series B Preferred Stock could also have the effect of depressing the market price for shares of our common stock.
| 16 |
Risks Related to our Business
We have incurred significant losses and negative operating cash flow in the past and we may incur losses and negative operating cash flow in the future, which may hamper our operations and impede us from expanding our business.
We have incurred significant losses and negative operating cash flow in the past. For 2013 and 2012, we incurred consolidated net losses of approximately $1.2 million and $43.4 million, respectively, and in 2012 incurred negative operating cash flow of $20.8 million. We may incur losses and negative operating cash flow in the future. We expect to rely on cash on hand and cash, if any, generated from our operations and from future financing activities to fund all of the cash requirements of our business. Continued losses and negative operating cash flow may hamper our operations and impede us from expanding our business.
Our results of operations and our ability to operate at a profit is largely dependent on managing the costs of corn and natural gas and the prices of ethanol, WDG and other ethanol co-products, all of which are subject to significant volatility and uncertainty.
Our results of operations are highly impacted by commodity prices, including the cost of corn and natural gas that we must purchase, and the prices of ethanol, WDG and other ethanol co-products that we sell. Prices and supplies are subject to and determined by market and other forces over which we have no control, such as weather, domestic and global demand, supply shortages, export prices and various governmental policies in the United States and around the world.
As a result of price volatility of corn, natural gas, ethanol, WDG and other ethanol co-products, our results of operations may fluctuate substantially. In addition, increases in corn or natural gas prices or decreases in ethanol, WDG or other ethanol co-product prices may make it unprofitable to operate. In fact, some of our marketing activities will likely be unprofitable in a market of generally declining ethanol prices due to the nature of our business. For example, to satisfy customer demands, we maintain certain quantities of ethanol inventory for subsequent resale. Moreover, we procure much of our inventory outside the context of a marketing arrangement and therefore must buy ethanol at a price established at the time of purchase and sell ethanol at an index price established later at the time of sale that is generally reflective of movements in the market price of ethanol. As a result, our margins for ethanol sold in these transactions generally decline and may turn negative as the market price of ethanol declines.
| 17 |
No assurance can be given that corn or natural gas can be purchased at, or near, current or any particular prices or that ethanol, WDG or other ethanol co-products will sell at, or near, current or any particular prices. Consequently, our results of operations and financial position may be adversely affected by increases in the price of corn or natural gas or decreases in the price of ethanol, WDG or other ethanol co-products.
Over the past several years, the spread between ethanol and corn prices has fluctuated significantly. Fluctuations are likely to continue to occur. A sustained narrow spread, whether as a result of sustained high or increased corn prices or sustained low or decreased ethanol prices, would adversely affect our results of operations and financial position. Further, combined revenues from sales of ethanol, WDG and other ethanol co-products could decline below the marginal cost of production, which may force us to suspend production of ethanol, WDG and ethanol co-products at some or all of the Pacific Ethanol Plants.
Increased ethanol production may cause a decline in ethanol prices or prevent ethanol prices from rising, and may have other negative effects, adversely impacting our results of operations, cash flows and financial condition.
We believe that the most significant factor influencing the price of ethanol has been the substantial increase in ethanol production in recent years. According to the RFA, domestic ethanol production capacity has increased from an annualized rate of 1.5 billion gallons per year in January 1999 to 14.5 billion gallons in 2014. In addition, due to significantly improved ethanol production margins, we anticipate that owners of idle ethanol production facilities, many of which were idled due to poor production margins, will restart operations, thereby resulting in more abundant ethanol supplies and inventories. Any increase in the demand for ethanol may not be commensurate with increases in the supply of ethanol, thus leading to lower ethanol prices. Also, demand for ethanol could be impaired due to a number of factors, including regulatory developments and reduced United States gasoline consumption. Reduced gasoline consumption has occurred in the past and could occur in the future as a result of increased gasoline or oil prices or other factors such as increased automobile fuel efficiency. Any of these outcomes could have a material adverse effect on our results of operations, cash flows and financial condition.
The market price of ethanol is volatile and subject to large fluctuations, which may cause our profitability or losses to fluctuate significantly.
The market price of ethanol is volatile and subject to large fluctuations. The market price of ethanol is dependent upon many factors, including the supply of ethanol and the price of gasoline, which is in turn dependent upon the price of petroleum which is highly volatile and difficult to forecast. For example, ethanol prices, as reported by the CBOT, ranged from $1.50 to $3.52 per gallon during 2014 and corn prices, as reported by the CBOT, ranged from $3.21 to $5.16 per bushel during 2014. Fluctuations in the market price of ethanol may cause our profitability or losses to fluctuate significantly.
Some of our marketing activities will likely be unprofitable in a market of generally declining ethanol prices due to the nature of our business.
Some of our marketing activities will likely be unprofitable in a market of generally declining ethanol prices due to the nature of our business. For example, to satisfy customer demands, we maintain certain quantities of ethanol inventory for subsequent resale. Moreover, we procure much of our inventory outside the context of a marketing arrangement and therefore must buy ethanol at a price established at the time of purchase and sell ethanol at an index price established later at the time of sale that is generally reflective of movements in the market price of ethanol. As a result, our margins for ethanol sold in these transactions generally decline and may turn negative as the market price of ethanol declines.
| 18 |
Disruptions in ethanol production infrastructure may adversely affect our business, results of operations and financial condition.
Our business depends on the continuing availability of rail, road, port, storage and distribution infrastructure. In particular, due to limited storage capacity at the Pacific Ethanol Plants and other considerations related to production efficiencies, the Pacific Ethanol Plants depend on just-in-time delivery of corn. The production of ethanol also requires a significant and uninterrupted supply of other raw materials and energy, primarily water, electricity and natural gas. The prices of electricity and natural gas have fluctuated significantly in the past and may fluctuate significantly in the future. Local water, electricity and gas utilities may not be able to reliably supply the water, electricity and natural gas that the Pacific Ethanol Plants will need or may not be able to supply those resources on acceptable terms. Any disruptions in the ethanol production infrastructure, whether caused by labor difficulties, earthquakes, storms, other natural disasters or human error or malfeasance or other reasons, could prevent timely deliveries of corn or other raw materials and energy and may require the Pacific Ethanol Plants to halt production which could have a material adverse effect on our business, results of operations and financial condition.
We and the Pacific Ethanol Plants may engage in hedging transactions and other risk mitigation strategies that could harm our results of operations.
In an attempt to partially offset the effects of volatility of ethanol prices and corn and natural gas costs, the Pacific Ethanol Plants may enter into contracts to fix the price of a portion of their ethanol production or purchase a portion of their corn or natural gas requirements on a forward basis. In addition, we may engage in other hedging transactions involving exchange-traded futures contracts for corn, natural gas and unleaded gasoline from time to time. The financial statement impact of these activities is dependent upon, among other things, the prices involved and our ability to sell sufficient products to use all of the corn and natural gas for which forward commitments have been made. Hedging arrangements also expose us to the risk of financial loss in situations where the other party to the hedging contract defaults on its contract or, in the case of exchange-traded contracts, where there is a change in the expected differential between the underlying price in the hedging agreement and the actual prices paid or received by us. As a result, our results of operations and financial condition may be adversely affected by fluctuations in the price of corn, natural gas, ethanol and unleaded gasoline.
Operational difficulties at the Pacific Ethanol Plants could negatively impact sales volumes and could cause us to incur substantial losses.
Operations at the Pacific Ethanol Plants are subject to labor disruptions, unscheduled downtimes and other operational hazards inherent in the ethanol production industry, including equipment failures, fires, explosions, abnormal pressures, blowouts, pipeline ruptures, transportation accidents and natural disasters. Some of these operational hazards may cause personal injury or loss of life, severe damage to or destruction of property and equipment or environmental damage, and may result in suspension of operations and the imposition of civil or criminal penalties. Insurance obtained by the Pacific Ethanol Plants may not be adequate to fully cover the potential operational hazards described above or the Pacific Ethanol Plants may not be able to renew this insurance on commercially reasonable terms or at all.
Moreover, the production facilities at the Pacific Ethanol Plants may not operate as planned or expected. All of these facilities are designed to operate at or above a specified production capacity. The operation of these facilities is and will be, however, subject to various uncertainties. As a result, these facilities may not produce ethanol and its co-products at expected levels. In the event any of these facilities do not run at their expected capacity levels, our business, results of operations and financial condition may be materially and adversely affected.
| 19 |
The United States ethanol industry is highly dependent upon certain federal and state legislation and regulation and any changes in legislation or regulation could have a material adverse effect on our results of operations, cash flows and financial condition.
The EPA has implemented the national RFS pursuant to the Energy Policy Act of 2005 and the Energy Independence and Security Act of 2007. The national RFS program sets annual quotas for the quantity of renewable fuels (such as ethanol) that must be blended into motor fuels consumed in the United States. The domestic market for ethanol is significantly impacted by federal mandates under the national RFS program for volumes of renewable fuels (such as ethanol) required to be blended with gasoline. Future demand for ethanol will be largely dependent upon incentives to blend ethanol into motor fuels, including the relative price of gasoline versus ethanol, the relative octane value of ethanol, constraints in the ability of vehicles to use higher ethanol blends, the national RFS, and other applicable environmental requirements. Any significant increase in production capacity above the national RFS minimum requirements may have an adverse impact on ethanol prices.
Legislation aimed at reducing or eliminating the renewable fuel use required by the national RFS has been introduced in the United States Congress. On February 4, 2015, the RFS Elimination Act (H.R. 703) was introduced in the House of Representatives. The bill would fully repeal the national RFS. Also introduced on February 4, 2015, was the RFS Reform Act (H.R. 704), which prohibits corn-based ethanol from meeting the national RFS requirements, caps the amount of ethanol that can be blended into conventional gasoline at 10%, and requires the EPA to set requirements for cellulosic biofuels at actual production levels. On February 3, 2015, a bill (H.R. 21) was introduced in the House of Representatives to vacate the waiver issued by EPA allowing the use of 15% ethanol blends in certain light-duty vehicles. On February 26, 2015, the Corn Ethanol Mandate Elimination Act of 2015 was introduced in the Senate. The bill would eliminate corn ethanol as qualifying as a renewable fuel under the national RFS. All of these bills were assigned to a congressional committee, which will consider them before possibly sending any of them on to the House of Representatives or the Senate as a whole. Our operations could be adversely impacted if the RFS Elimination Act, the RFS Reform Act, the Corn Ethanol Mandate Elimination Act or other legislation is enacted that reduces or eliminates the national RFS volume requirements or that reduces or eliminates corn ethanol as qualifying as a renewable fuel under the national RFS.
Under the provisions of the Clean Air Act, as amended by the Energy Independence and Security Act of 2007, the EPA has limited authority to waive or reduce the mandated national RFS requirements, which authority is subject to consultation with the Secretaries of Agriculture and Energy, and based on a determination that there is inadequate domestic renewable fuel supply or implementation of the applicable requirements would severely harm the economy or environment of a state, region or the United States. On November 15, 2013, the EPA released its Notice of Proposed Rulemaking for the national RFS for 2014. The EPA proposed to reduce the RVO for 2014 for key categories of biofuel covered by the national RFS below the 2014 volumes specified in 2007 by the Energy Independence and Security Act of 2007 and below the RVO for 2013. However, the EPA withdrew its proposal on December 9, 2014, and announced that it would not finalize the RVO for 2014 until 2015. The EPA has indicated that its previous 2014 draft proposal for a total of 15.2 billion gallons for all renewable fuels, including 13.0 billion gallons for conventional renewable fuels in 2014, will not be the final regulation and that it expects to issue the final RVO for 2014 in the second quarter of 2015. In addition, the EPA announced that it would propose the RVO for 2015 and 2016 simultaneously in 2015. Our operations could be adversely impacted if the EPA finalizes RVO levels that are below the levels specified in the national RFS.
| 20 |
Future demand for ethanol is uncertain and may be affected by changes to federal mandates, public perception, consumer acceptance and overall consumer demand for transportation fuel, any of which could negatively affect demand for ethanol and our results of operations.
Although many trade groups, academics and governmental agencies have supported ethanol as a fuel additive that promotes a cleaner environment, others have criticized ethanol production as consuming considerably more energy and emitting more greenhouse gases than other biofuels and potentially depleting water resources. Some studies have suggested that corn-based ethanol is less efficient than ethanol produced from other feedstock and that it negatively impacts consumers by causing increased prices for dairy, meat and other food generated from livestock that consume corn. Additionally, ethanol critics contend that corn supplies are redirected from international food markets to domestic fuel markets. If negative views of corn-based ethanol production gain acceptance, support for existing measures promoting use and domestic production of corn-based ethanol could decline, leading to reduction or repeal of federal mandates, which would adversely affect the demand for ethanol. These views could also negatively impact public perception of the ethanol industry and acceptance of ethanol as an alternative fuel.
There are limited markets for ethanol beyond those established by federal mandates. Discretionary blending and E85 blending are important secondary markets. Discretionary blending is often determined by the price of ethanol versus the price of gasoline. In periods when discretionary blending is financially unattractive, the demand for ethanol may be reduced. Also, the demand for ethanol is affected by the overall demand for transportation fuel, which peaked in 2007 and has declined steadily since then. Demand for transportation fuel is affected by the number of miles traveled by consumers and the fuel economy of vehicles. Market acceptance of E15 may partially offset the effects of decreases in transportation fuel demand. A reduction in the demand for ethanol and ethanol co-products may depress the value of our products, erode our margins and reduce our ability to generate revenue or to operate profitably. Consumer acceptance of E15 and E85 fuels is needed before ethanol can achieve any significant growth in market share relative to other transportation fuels.
The ethanol production and marketing industry is extremely competitive. Many of our significant competitors have greater production and financial resources and one or more of these competitors could use their greater resources to gain market share at our expense. In addition, a number of Kinergy’s suppliers may circumvent the marketing services we provide, causing our sales and profitability to decline.
The ethanol production and marketing industry is extremely competitive. Many of our significant competitors in the ethanol production and marketing industry, including Archer Daniels Midland Company and Valero Energy Corporation, have substantially greater production and/or financial resources. As a result, our competitors may be able to compete more aggressively and sustain that competition over a longer period of time. Successful competition will require a continued high level of investment in marketing and customer service and support. Our limited resources relative to many significant competitors may cause us to fail to anticipate or respond adequately to new developments and other competitive pressures. This failure could reduce our competitiveness and cause a decline in market share, sales and profitability. Even if sufficient funds are available, we may not be able to make the modifications and improvements necessary to compete successfully.
We also face increasing competition from international suppliers. Currently, international suppliers produce ethanol primarily from sugar cane and have cost structures that are generally substantially lower than the cost structures of the Pacific Ethanol Plants. Any increase in domestic or foreign competition could cause the Pacific Ethanol Plants to reduce their prices and take other steps to compete effectively, which could adversely affect their and our results of operations and financial condition.
In addition, some of our suppliers are potential competitors and, especially if the price of ethanol reaches historically high levels, they may seek to capture additional profits by circumventing our marketing services in favor of selling directly to our customers. If one or more of our major suppliers, or numerous smaller suppliers, circumvent our marketing services, our sales and profitability may decline.
| 21 |
If Kinergy fails to satisfy its financial covenants under its credit facility, it may experience a loss or reduction of that facility, which would have a material adverse effect on our financial condition and results of operations.
We are substantially dependent on Kinergy’s credit facility to help finance its operations. Kinergy must satisfy monthly financial covenants under its credit facility, including covenants regarding its earnings before interest, taxes, depreciation and amortization (EBITDA) and fixed-charge coverage ratios. Kinergy will be in default under its credit facility if it fails to satisfy any financial covenant. A default may result in the loss or reduction of the credit facility. The loss of Kinergy’s credit facility, or a significant reduction in Kinergy’s borrowing capacity under the facility, would result in Kinergy’s inability to finance a significant portion of its business and would have a material adverse effect on our financial condition and results of operations.
The high concentration of our sales within the ethanol production and marketing industry could result in a significant reduction in sales and negatively affect our profitability if demand for ethanol declines.
We expect to be completely focused on the production and marketing of ethanol and its co-products for the foreseeable future. We may be unable to shift our business focus away from the production and marketing of ethanol to other renewable fuels or competing products. Accordingly, an industry shift away from ethanol or the emergence of new competing products may reduce the demand for ethanol. A downturn in the demand for ethanol would likely materially and adversely affect our sales and profitability.
In addition to ethanol produced by the Pacific Ethanol Plants, we also depend on one third-party supplier for a significant portion of the ethanol we sell. If this supplier does not continue to supply us with ethanol in adequate amounts, we may be unable to satisfy the demands of our customers and our sales, profitability and relationships with our customers will be adversely affected.
In addition to the ethanol produced by the Pacific Ethanol Plants, we also depend, and expect to continue to depend for the foreseeable future, on one third-party supplier for a significant portion of the total amount of ethanol that we sell. During 2014, 2013 and 2012, one supplier provided in excess of 10% of the total volume of ethanol we sold, accounting for an aggregate of approximately $134.6 million, $145.2 million and $109.9 million in net sales, representing 12%, 16% and 13% of our net sales, respectively, for those periods. This third-party supplier is located in the Midwest. The delivery of ethanol from this supplier is therefore subject to delays resulting from inclement weather and other conditions. If this supplier is unable or declines for any reason to continue to supply us with ethanol in adequate amounts, we may be unable to replace that supplier and source other supplies of ethanol in a timely manner, or at all, to satisfy the demands of our customers. If this occurs, our sales, profitability and our relationships with our customers will be adversely affected.
We may be adversely affected by environmental, health and safety laws, regulations and liabilities.
We are subject to various federal, state and local environmental laws and regulations, including those relating to the discharge of materials into the air, water and ground, the generation, storage, handling, use, transportation and disposal of hazardous materials and wastes, and the health and safety of our employees. In addition, some of these laws and regulations require us to operate under permits that are subject to renewal or modification. These laws, regulations and permits can often require expensive pollution control equipment or operational changes to limit actual or potential impacts to the environment. A violation of these laws and regulations or permit conditions can result in substantial fines, natural resource damages, criminal sanctions, permit revocations and/or facility shutdowns. In addition, we have made, and expect to make, significant capital expenditures on an ongoing basis to comply with increasingly stringent environmental laws, regulations and permits.
| 22 |
We may be liable for the investigation and cleanup of environmental contamination at each of the Pacific Ethanol Plants and at off-site locations where we arrange for the disposal of hazardous substances or wastes. If these substances or wastes have been or are disposed of or released at sites that undergo investigation and/or remediation by regulatory agencies, we may be responsible under the Comprehensive Environmental Response, Compensation and Liability Act of 1980, or other environmental laws for all or part of the costs of investigation and/or remediation, and for damages to natural resources. We may also be subject to related claims by private parties alleging property damage and personal injury due to exposure to hazardous or other materials at or from those properties. Some of these matters may require us to expend significant amounts for investigation, cleanup or other costs.
In addition, new laws, new interpretations of existing laws, increased governmental enforcement of environmental laws or other developments could require us to make significant additional expenditures. Continued government and public emphasis on environmental issues can be expected to result in increased future investments for environmental controls at the Pacific Ethanol Plants. Present and future environmental laws and regulations, and interpretations of those laws and regulations, applicable to our operations, more vigorous enforcement policies and discovery of currently unknown conditions may require substantial expenditures that could have a material adverse effect on our results of operations and financial condition.
The hazards and risks associated with producing and transporting our products (including fires, natural disasters, explosions and abnormal pressures and blowouts) may also result in personal injury claims or damage to property and third parties. As protection against operating hazards, we maintain insurance coverage against some, but not all, potential losses. However, we could sustain losses for uninsurable or uninsured risks, or in amounts in excess of existing insurance coverage. Events that result in significant personal injury or damage to our property or third parties or other losses that are not fully covered by insurance could have a material adverse effect on our results of operations and financial condition.
If we are unable to attract and retain key personnel, our ability to operate effectively may be impaired.
Our ability to operate our business and implement strategies depends, in part, on the efforts of our executive officers and other key employees. Our future success will depend on, among other factors, our ability to retain our current key personnel and attract and retain qualified future key personnel, particularly executive management. Failure to attract or retain key personnel could have a material adverse effect on our business and results of operations.
We depend on a small number of customers for the majority of our sales. A reduction in business from any of these customers could cause a significant decline in our overall sales and profitability.
The majority of our sales are generated from a small number of customers. During 2014, 2013 and 2012, four customers accounted for an aggregate of approximately $659 million, $521 million and $410 million in net sales, representing 59%, 58% and 51% of our net sales, respectively, for those periods. We expect that we will continue to depend for the foreseeable future upon a small number of customers for a significant portion of our sales. Our agreements with these customers generally do not require them to purchase any specified amount of ethanol or dollar amount of sales or to make any purchases whatsoever. Therefore, in any future period, our sales generated from these customers, individually or in the aggregate, may not equal or exceed historical levels. If sales to any of these customers cease or decline, we may be unable to replace these sales with sales to either existing or new customers in a timely manner, or at all. A cessation or reduction of sales to one or more of these customers could cause a significant decline in our overall sales and profitability.
| 23 |
Our lack of long-term ethanol orders and commitments by our customers could lead to a rapid decline in our sales and profitability.
We cannot rely on long-term ethanol orders or commitments by our customers for protection from the negative financial effects of a decline in the demand for ethanol or a decline in the demand for our marketing services. The limited certainty of ethanol orders can make it difficult for us to forecast our sales and allocate our resources in a manner consistent with our actual sales. Moreover, our expense levels are based in part on our expectations of future sales and, if our expectations regarding future sales are inaccurate, we may be unable to reduce costs in a timely manner to adjust for sales shortfalls. Furthermore, because we depend on a small number of customers for a significant portion of our sales, the magnitude of the ramifications of these risks is greater than if our sales were less concentrated. As a result of our lack of long-term ethanol orders and commitments, we may experience a rapid decline in our sales and profitability.
There are limitations on our ability to receive distributions from our subsidiaries.
We conduct most of our operations through subsidiaries and are dependent upon dividends or other intercompany transfers of funds from our subsidiaries to generate free cash flow. Moreover, some of our subsidiaries are limited in their ability to pay dividends or make distributions to us by the terms of their financing arrangements.
Risks Related to Ownership of our Common Stock
Our stock price is highly volatile, which could result in substantial losses for investors purchasing shares of our common stock and in litigation against us.
The market price of our common stock has fluctuated significantly in the past and may continue to fluctuate significantly in the future. The market price of our common stock may continue to fluctuate in response to one or more of the following factors, many of which are beyond our control:
| · | fluctuations in the market prices of ethanol and its co-products, including WDG and corn oil; |
| · | the cost of key inputs to the production of ethanol, including corn and natural gas; |
| · | the volume and timing of the receipt of orders for ethanol from major customers; |
| · | competitive pricing pressures; |
| · | our ability to timely and cost-effectively produce, sell and deliver ethanol; |
| · | the announcement, introduction and market acceptance of one or more alternatives to ethanol; |
| · | losses resulting from adjustments to the fair values of our outstanding warrants to purchase our common stock; |
| · | changes in market valuations of companies similar to us; |
| · | stock market price and volume fluctuations generally; | |
| · | the possibility that the anticipated benefits from our pending acquisition of Aventine cannot be fully realized in a timely manner or at all, or that integrating future acquired operations will be more difficult, disruptive or costly than anticipated; |
| · | regulatory developments or increased enforcement; |
| · | fluctuations in our quarterly or annual operating results; |
| · | additions or departures of key personnel; |
| · | our inability to obtain any necessary financing; |
| · | our financing activities and future sales of our common stock or other securities; and |
| · | our ability to maintain contracts that are critical to our operations. |
Furthermore, we believe that the economic conditions in California and other Western states, as well as the United States as a whole, could have a negative impact on our results of operations. Demand for ethanol could also be adversely affected by a slow-down in the overall demand for oxygenate and gasoline additive products. The levels of our ethanol production and purchases for resale will be based upon forecasted demand. Accordingly, any inaccuracy in forecasting anticipated revenues and expenses could adversely affect our business. The failure to receive anticipated orders or to complete delivery in any quarterly period could adversely affect our results of operations for that period. Quarterly results are not necessarily indicative of future performance for any particular period, and we may not experience revenue growth or profitability on a quarterly or an annual basis.
The price at which you purchase shares of our common stock may not be indicative of the price that will prevail in the trading market. You may be unable to sell your shares of common stock at or above your purchase price, which may result in substantial losses to you and which may include the complete loss of your investment. In the past, securities class action litigation has often been brought against a company following periods of high stock price volatility. We may be the target of similar litigation in the future. Securities litigation could result in substantial costs and divert management’s attention and our resources away from our business.
Any of the risks described above could have a material adverse effect on our results of operations or the price of our common stock, or both.
| 24 |
We may incur significant non-cash expenses in future periods due to adjustments to the fair values of our outstanding warrants. These non-cash expenses may materially and adversely affect our reported net income or losses and cause our stock price to decline.
From 2010 through 2013, we issued in various financing transactions warrants to purchase shares of our common stock. The warrants were initially recorded at their fair values, which are adjusted quarterly, generally resulting in non-cash expenses or income if the market price of our common stock increases or decreases, respectively, during the period. For example, due to the substantial increase in the market price of our common stock in the first quarter of 2014 and because the exercise prices of these warrants were, as of March 31, 2014, well below the market price of our common stock, the fair values of the warrants and the related non-cash expenses were significantly higher in the first quarter of 2014 than in prior quarterly periods, which resulted in an unusually large non-cash expense for the quarter. These fair value adjustments will continue in future periods until all of our warrants are exercised or expire. We may incur additional significant non-cash expenses in future periods due to adjustments to the fair values of our outstanding warrants resulting from increases in the market price of our common stock during those periods. These non-cash expenses may materially and adversely affect our reported net income or losses and cause our stock price to decline.
The conversion or exercise of our outstanding derivative securities or the issuance of shares of our common stock in lieu of accrued and unpaid dividends on our Series B Preferred Stock could substantially dilute your investment, reduce your voting power, and, if the resulting shares of common stock are resold into the market, or if a perception exists that a substantial number of shares may be issued and then resold into the market, the market price of our common stock and the value of your investment could decline significantly.
Our Series B Preferred Stock, which is convertible into our common stock, and outstanding options to acquire our common stock issued to employees, directors and others, and warrants to purchase our common stock, allow the holders of these derivative securities an opportunity to profit from a rise in the market price of our common stock. In addition, we may elect to issue shares of our common stock in lieu of accrued and unpaid cash dividends on our Series B Preferred Stock. We have issued common stock in respect of our derivative securities and accrued and unpaid dividends on our Series B Preferred Stock in the past and may do so in the future. If the prices at which our derivative securities are converted or exercised, or at which shares of common stock in lieu of accrued and unpaid dividends on our Series B Preferred Stock are issued, are lower than the price at which you made your investment, immediate dilution of the value of your investment will occur. Our issuance of shares of common stock under these circumstances will also reduce your voting power. In addition, sales of a substantial number of shares of common stock resulting from any of these issuances, or even the perception that these sales could occur, could adversely affect the market price of our common stock. As a result, you could experience a significant decline in the value of your investment as a result of both the actual and potential issuance of shares of our common stock.
| 25 |
| Item 1B. | Unresolved Staff Comments. |
We have received no written comments regarding our periodic or current reports from the staff of the Securities and Exchange Commission that were issued 180 days or more preceding the end of our 2014 fiscal year and that remain unresolved.
| Item 2. | Properties. |
Our corporate headquarters, located in Sacramento, California, consists of a 10,000 square foot office under a lease expiring in 2018. The Pacific Ethanol Plants are located in Madera, California, at a 137 acre facility; Boardman, Oregon, at a 25 acre facility; Burley, Idaho, at a 160 acre facility; and Stockton, California, at a 30 acre facility. The land in Madera, California and Burley, Idaho is owned by the Plant Owners. The land in Boardman, Oregon and Stockton, California are leased by the Plant Owners under leases expiring in 2026 and 2022, respectively. See “Business—Production Facilities.”
| Item 3. | Legal Proceedings. |
We are subject to legal proceedings, claims and litigation arising in the ordinary course of business. While the amounts claimed may be substantial, the ultimate liability cannot presently be determined because of considerable uncertainties that exist. Therefore, it is possible that the outcome of those legal proceedings, claims and litigation could adversely affect our quarterly or annual operating results or cash flows when resolved in a future period. However, based on facts currently available, management believes such matters will not adversely affect in any material respect our financial position, results of operations or cash flows.
On May 24, 2013, GS CleanTech Corporation (“GS CleanTech”), filed a suit in the United States District Court for the Eastern District of California, Sacramento Division (Case No.: 2:13-CV-01042-JAM-AC), naming Pacific Ethanol, Inc. as a defendant. On August 29, 2013, the case was transferred to the United States District Court for the Southern District of Indiana and made part of the pre-existing multi-district litigation involving GS CleanTech and multiple defendants. The suit alleged infringement of a patent assigned to GS CleanTech by virtue of certain corn oil separation technology in use at one or more of the ethanol production facilities in which we have an interest, including Pacific Ethanol Stockton LLC (“PE Stockton”), located in Stockton, California. The complaint sought preliminary and permanent injunctions against us, prohibiting future infringement on the patent owned by GS CleanTech and damages in an unspecified amount adequate to compensate GS CleanTech for the alleged patent infringement, but in any event no less than a reasonable royalty for the use made of the inventions of the patent, plus attorneys’ fees. We answered the complaint, counterclaimed that the patent claims at issue, as well as the claims in several related patents, are invalid and unenforceable and that we are not infringing. Pacific Ethanol, Inc. does not itself use any corn oil separation technology and we may seek a dismissal on those grounds.
| 26 |
On March 17 and March 18, 2014, GS CleanTech filed suit naming as defendants two of our subsidiaries: PE Stockton and Pacific Ethanol Magic Valley, LLC (“PE Magic Valley”). The claims were similar to those filed against Pacific Ethanol, Inc. in May 2013. These two cases were transferred to the multi-district litigation division in United States District Court for the Southern District of Indiana, where the case against Pacific Ethanol, Inc. was pending. Although PE Stockton and PE Magic Valley do separate and market corn oil, Pacific Ethanol, Inc., PE Stockton and PE Magic Valley strongly disagree that either of the subsidiaries use corn oil separation technology that infringes the patent owned by GS CleanTech. In a January 16, 2015 decision, the District Court for the Southern District of Indiana ruled in favor of a stipulated motion for partial summary judgment for Pacific Ethanol, Inc., PE Stockton and PE Magic Valley finding that all of the GS Cleantech patents in the suit were invalid and, therefore, not infringed. GS Cleantech has said it will appeal this decision when the remaining claim in the suit has been decided. The only remaining claim alleges that GS Cleantech inequitably conducted itself before the United States Patent Office when obtaining the patents at issue. A trial in the District Court for the Southern District of Indiana on that single issue is expected later in 2015. If the Defendants, including Pacific Ethanol, Inc., PE Stockton and PE Magic Valley, succeed in proving inequitable conduct, then the Court will be asked to determine whether GS Cleantech’s behavior makes this an “exceptional case”. A finding that this is an exceptional case would allow the Court to award to Pacific Ethanol, Inc., PE Stockton and PE Magic Valley the attorneys’ fees expended to date for defense in this case. It is unknown whether GS Cleantech would appeal such a ruling. We did not record a provision for these matters as of December 31, 2014 as we intend to vigorously defend these allegations and believe a material adverse ruling against Pacific Ethanol, Inc., PE Stockton and/or PE Magic Valley is not probable. We believe that any liability Pacific Ethanol, Inc., PE Stockton and/or PE Magic Valley may incur would not have a material adverse effect on our financial condition or results of operations.
| Item 4. | Mine Safety Disclosures. |
Not applicable.
| 27 |
PART II
| Item 5. | Market For Registrant’s Common Equity, Related Stockholder Matters and Issuer Purchases of Equity Securities. |
Market Information
Our common stock trades on The NASDAQ Capital Market under the symbol “PEIX”. On May 14, 2013, we effected a one-for-fifteen reverse split of our common stock. The table below shows, for each fiscal quarter indicated, the high and low sales prices of shares of our common stock. The prices for periods prior May 14, 2013 have been retroactively restated as if the reverse split had occurred on January 1, 2013. The prices shown reflect inter-dealer prices, without retail mark-up, mark-down or commission, and may not necessarily represent actual transactions.
| Price Range | ||||||||
| High | Low | |||||||
| Year Ended December 31, 2014: | ||||||||
| First Quarter (January 1 – March 31) | $ | 18.20 | $ | 4.83 | ||||
| Second Quarter (April 1 – June 30) | $ | 18.65 | $ | 10.43 | ||||
| Third Quarter (July 1 – September 30) | $ | 23.97 | $ | 13.75 | ||||
| Fourth Quarter (October 1 – December 31) | $ | 15.57 | $ | 9.10 | ||||
| Year Ended December 31, 2013: | ||||||||
| First Quarter | $ | 7.05 | $ | 4.50 | ||||
| Second Quarter | $ | 5.69 | $ | 3.42 | ||||
| Third Quarter | $ | 4.98 | $ | 3.45 | ||||
| Fourth Quarter | $ | 5.52 | $ | 2.33 | ||||
Security Holders
As of March 13, 2015, we had 24,511,200 shares of common stock outstanding held of record by approximately 300 stockholders. These holders of record include depositories that hold shares of stock for brokerage firms which, in turn, hold shares of stock for numerous beneficial owners. On March 13, 2015, the closing sales price of our common stock on The NASDAQ Capital Market was $10.29 per share.
Performance Graph
The graph below shows a comparison of the cumulative total stockholder return on our common stock with the cumulative total return on The NASDAQ Composite Index and The NASDAQ Clean Edge Green Energy Index, or Peer Group, in each case over the five-year period ended December 31, 2014.
The graph assumes $100 invested at the indicated starting date in our common stock and in each of The NASDAQ Composite Index and the Peer Group, with the reinvestment of all dividends. We have not paid or declared any cash dividends on our common stock and do not anticipate paying any cash dividends on our common stock in the foreseeable future. Stockholder returns over the indicated periods should not be considered indicative of future stock prices or stockholder returns. This graph assumes that the value of the investment in our common stock and each of the comparison groups was $100 on December 31, 2009.
| 28 |
| Cumulative Total Return ($) | ||||||
| 12/09 | 12/10 | 12/11 | 12/12 | 12/13 | 12/14 | |
| PACIFIC ETHANOL, INC. | 100.00 | 101.65 | 21.33 | 6.36 | 6.83 | 13.86 |
| THE NASDAQ COMPOSITE INDEX | 100.00 | 117.43 | 118.27 | 138.47 | 196.27 | 223.17 |
| THE NASDAQ CLEAN EDGE GREEN ENERGY INDEX | 100.00 | 104.21 | 63.71 | 65.59 | 121.90 | 126.44 |
Dividend Policy
We have never paid cash dividends on our common stock and do not intend to pay cash dividends on our common stock in the foreseeable future. We anticipate that we will retain any earnings for use in the continued development of our business.
Our current and future debt financing arrangements may limit or prevent cash distributions from our subsidiaries to us, depending upon the achievement of specified financial and other operating conditions and our ability to properly service our debt, thereby limiting or preventing us from paying cash dividends. Further, the holders of our outstanding Series B Preferred Stock are entitled to dividends of 7% per annum, payable quarterly in arrears. In 2012, 2013 and 2014, we declared and paid in cash dividends on our outstanding shares of Series B Preferred Stock as they became due. Accrued and unpaid dividends in respect of our Series B Preferred Stock must be paid prior to the payment of any dividends in respect of shares of our common stock.
| 29 |
Recent Sales of Unregistered Securities
Not applicable.
Purchases of Equity Securities by the Issuer and Affiliated Purchasers
We granted to certain employees and directors shares of restricted stock under our 2006 Stock Incentive Plan pursuant to Restricted Stock Agreements dated and effective as of their respective grant dates by and between us and those employees and directors.
We were obligated to withhold minimum withholding tax amounts with respect to vested shares of restricted stock and upon future vesting of shares of restricted stock granted to our employees. Each employee was entitled to pay the minimum withholding tax amounts to us in cash or to elect to have us withhold a vested amount of shares of restricted stock having a value equivalent to our minimum withholding tax requirements, thereby reducing the number of shares of vested restricted stock that the employee ultimately receives. If an employee failed to timely make such election, we automatically withheld the necessary shares of vested restricted stock.
In 2014, in connection with satisfying our withholding requirements, we withheld the following number of shares of our common stock and remitted cash payments to cover the minimum withholding tax amounts, thereby effectively repurchasing from the employees such number of shares of our common stock at the following deemed purchase prices:
| Month | Number of Shares Withheld | Deemed Purchase Price Per Share | Aggregate Purchase Price | |||||||||||
| April | 54,601 | $ | 17.90 | $ | 977,358 | |||||||||
| October | 75 | $ | 13.25 | $ | 994 | |||||||||
| Total | 54,676 | $ | 978,352 | |||||||||||
| Item 6. | Selected Financial Data. |
The following table sets forth our selected consolidated financial data. We prepared this information using our consolidated financial statements for each of the years ended December 31, 2014, 2013, 2012, 2011 and 2010.
You should read this selected consolidated financial data together with the consolidated financial statements and related notes contained in this report and in our prior and subsequent reports filed with the Securities and Exchange Commission, as well as the section of this report and our other reports entitled “Management’s Discussion and Analysis of Financial Condition and Results of Operations.” The historical results that appear below are not necessarily indicative of results to be expected for any future periods.
| 30 |
| Years Ended December 31, | ||||||||||||||||||||
| 2014 | 2013 | 2012 | 2011 | 2010 | ||||||||||||||||
| (in thousands, except per share data) | ||||||||||||||||||||
| Consolidated Statements of Operations Data: | ||||||||||||||||||||
| Net sales | $ | 1,107,412 | $ | 908,437 | $ | 816,044 | $ | 901,188 | $ | 328,332 | ||||||||||
| Cost of goods sold | 998,927 | 875,507 | 835,568 | 881,789 | 329,143 | |||||||||||||||
| Gross profit (loss) | 108,485 | 32,930 | (19,524 | ) | 19,399 | (811 | ) | |||||||||||||
| Selling, general and administrative expenses | 17,108 | 14,021 | 12,141 | 15,427 | 12,956 | |||||||||||||||
| Income (loss) from operations | 91,377 | 18,909 | (31,665 | ) | 3,972 | (13,767 | ) | |||||||||||||
| Fair value adjustments and warrant inducements | (37,532 | ) | (1,013 | ) | 1,954 | 7,559 | (11,736 | ) | ||||||||||||
| Interest expense, net | (9,438 | ) | (15,671 | ) | (13,049 | ) | (14,813 | ) | (6,804 | ) | ||||||||||
| Loss on extinguishments of debt | (2,363 | ) | (3,035 | ) | – | – | (2,159 | ) | ||||||||||||
| Loss on investment in Front Range | – | – | – | – | (12,146 | ) | ||||||||||||||
| Gain from bankruptcy exit | – | – | – | – | 119,408 | |||||||||||||||
| Reorganization costs | – | – | – | – | (4,153 | ) | ||||||||||||||
| Other income (expense), net | (905 | ) | (352 | ) | (595 | ) | (741 | ) | 840 | |||||||||||
| Income (loss) before provision for income taxes | 41,139 | (1,162 | ) | (43,355 | ) | (4,023 | ) | 69,483 | ||||||||||||
| Provision for income taxes | 15,137 | – | – | – | – | |||||||||||||||
| Consolidated net income (loss) | 26,002 | (1,162 | ) | (43,355 | ) | (4,023 | ) | 69,483 | ||||||||||||
| Net (income) loss attributed to noncontrolling interests | (4,713 | ) | 381 | 24,298 | 7,097 | 4,409 | ||||||||||||||
| Net income (loss) attributed to Pacific Ethanol, Inc. | $ | 21,289 | $ | (781 | ) | $ | (19,057 | ) | $ | 3,074 | $ | 73,892 | ||||||||
| Preferred stock dividends | (1,265 | ) | (1,265 | ) | (1,268 | ) | (1,265 | ) | (2,847 | ) | ||||||||||
| Income (loss) available to common stockholders | $ | 20,024 | $ | (2,046 | ) | $ | (20,325 | ) | $ | 1,809 | $ | 71,045 | ||||||||
| Income (loss) per share, basic | $ | 0.96 | $ | (0.17 | ) | $ | (2.81 | ) | $ | 0.80 | $ | 101.35 | ||||||||
| Income (loss) per share, diluted | $ | 0.88 | $ | (0.17 | ) | $ | (2.81 | ) | $ | 0.80 | $ | 83.48 | ||||||||
| Basic weighted-average shares | 20,810 | 12,264 | 7,224 | 2,249 | 701 | |||||||||||||||
| Diluted weighted-average shares | 22,669 | 12,264 | 7,224 | 2,266 | 893 | |||||||||||||||
| Consolidated Balance Sheet Data: | ||||||||||||||||||||
| Cash and cash equivalents | $ | 62,084 | $ | 5,151 | $ | 7,586 | $ | 8,914 | $ | 8,736 | ||||||||||
| Working capital | $ | 114,104 | $ | 51,161 | $ | 45,017 | $ | 57,766 | $ | 9,493 | ||||||||||
| Total assets | $ | 299,502 | $ | 241,049 | $ | 214,963 | $ | 232,476 | $ | 234,083 | ||||||||||
| Long-term debt | $ | 34,533 | $ | 99,158 | $ | 121,282 | $ | 94,439 | $ | 123,089 | ||||||||||
| Stockholders’ equity | $ | 217,982 | $ | 94,901 | $ | 72,907 | $ | 119,264 | $ | 87,815 | ||||||||||
No cash dividends on our common stock were declared during any of the periods presented above.
| 31 |
| Item 7. | Management’s Discussion and Analysis of Financial Condition and Results of Operations. |
The following discussion and analysis of our financial condition and results of operations should be read in conjunction with our consolidated financial statements and notes to consolidated financial statements included elsewhere in this report. This discussion contains forward-looking statements, reflecting our plans and objectives that involve risks and uncertainties. Actual results and the timing of events may differ materially from those contained in these forward-looking statements due to a number of factors, including those discussed in the section entitled “Risk Factors” and elsewhere in this report.
Overview
We are the leading producer and marketer of low-carbon renewable fuels in the Western United States.
We have extensive customer relationships throughout the Western United States. Our ethanol customers are integrated oil companies and gasoline marketers who blend ethanol into gasoline. These customers collectively require ethanol volumes in excess of the supply produced in the Western United States. We arrange for transportation, storage and delivery of ethanol purchased by our customers through our agreements with third-party service providers in the Western United States, as well as in the Midwest from a variety of sources. In 2014, we obtained approximately 42% of our ethanol supplies from Midwest producers to supplement ethanol produced in the Western United States, including by the Pacific Ethanol Plants. We also market ethanol co-products, including WDG and corn oil for the Pacific Ethanol Plants. Our WDG customers are dairies and feedlots located near the Pacific Ethanol Plants. Our corn oil is sold to poultry and biodiesel customers. We do not market co-products from other ethanol producers.
We market all the ethanol we sell through Kinergy. We hold a 96% ownership interest in PE Op Co., the owner of each of the plant holding companies, or the Plant Owners, that collectively own the Pacific Ethanol Plants. We operate and maintain the Pacific Ethanol Plants under the terms of an asset management agreement with the Plant Owners, and supply all goods and materials necessary to operate and maintain each Pacific Ethanol Plant.
Our ethanol customers rely on us to provide a reliable supply of product, and manage the logistics and timing of delivery with very little effort on their side. In meeting the needs of our customers, we secure supply from a variety of sources, including the Pacific Ethanol Plants, other plants in California for which we market, and suppliers in the Midwest, where a majority of ethanol manufacturers are located.
The Pacific Ethanol Plants are comprised of the four facilities described immediately below and have an aggregate annual production capacity of up to 200 million gallons. The facilities are near their respective fuel and feed customers, offering significant timing, transportation cost and logistical advantages.
Facility Name |
Facility Location |
Estimated
Annual Capacity | ||
| Magic Valley | Burley, ID | 60,000,000 | ||
| Columbia | Boardman, OR | 40,000,000 | ||
| Stockton | Stockton, CA | 60,000,000 | ||
| Madera | Madera, CA | 40,000,000 |
We intend to advance our position as the leading producer and marketer of low-carbon renewable fuels in the Western United States, in part by expanding our relationships with our current customers and establishing new relationships with customers outside that region. As we develop new customer relationships, we will seek new suppliers including through the acquisition of additional production facilities. We have entered into a definitive merger agreement with Aventine, as discussed below, which we expect will add 315 million gallons of annual capacity to our existing portfolio of ethanol production assets, as well as additional supplies of co-products.
| 32 |
Recent Development
Proposed Merger with Aventine
On December 30, 2014, we entered into a definitive merger agreement with Aventine, a Midwest ethanol producer, under which we plan to acquire Aventine through a merger. The merger agreement provides that, upon the terms and subject to the conditions set forth in the merger agreement, one of our wholly-owned subsidiaries will merge with and into Aventine, with Aventine surviving as one of our wholly-owned subsidiaries. Subject to the terms and conditions of the merger agreement, which was approved by our board of directors and the board of directors of Aventine, if the merger is completed, each outstanding share of Aventine common stock will be converted into the right to receive 1.25 shares of our common stock, and we will issue approximately 17.75 million shares of our common stock to the former stockholders of Aventine. The merger is expected to result in our stockholders holding approximately 58% of the combined company.
The merger transaction, which is intended to be structured as a tax-free exchange of shares, is expected to close during the second quarter of 2015, and is subject to closing conditions, including obtaining certain regulatory approvals and approvals from the stockholders of both companies.
We expect to incur significant expenses in connection with the merger. While we have assumed that a certain level of expenses will be incurred, there are many factors that could affect the total amount or the timing of the merger expenses, and many of the expenses that will be incurred are, by their nature, difficult to estimate. These expenses could result in the combined company taking significant charges against earnings following the completion of the merger. The ultimate amount and timing of such charges are uncertain at the present time. We incurred $0.7 million in professional and other fees associated with the proposed merger during the year ended December 31, 2014.
Current Initiatives and Outlook
The ethanol industry experienced margin compression in the fourth quarter of 2014 and early 2015. Overall crush margins, which reflect ethanol sales prices relative to the price of corn, declined consistent with the seasonal drop in demand for transportation fuel but also declined due to record industry production resulting in inventory levels at multi-year highs. The industry achieved a record annualized run rate in December 2014 of 15.2 billion gallons, which has recently moderated to an annualized run rate of 14.3 billion gallons, of ethanol production. We have, along with others in the industry, reduced production in the first quarter of 2015 to better balance supply and demand. Our plants are currently operating at 90% of capacity. We expect to increase production levels in the second quarter and for the balance of 2015 once a better supply and demand balance is achieved.
As noted above, part of the decline in margins is attributable to seasonality, with lower demand in the winter months, driven by lower overall demand for gasoline. We expect a better supply and demand balance during the summer and fall months, due to higher overall demand for gasoline during the driving season. We remain confident in the long-term demand for renewable fuels and our ability to execute and create value. Even with the recent drop in fuel prices, ethanol continues to trade at a significant discount to the wholesale price of gasoline. We believe this underscores the value of ethanol as a high-octane, cleaner-burning and cheapest available liquid transportation fuel.
| 33 |
E15 is slowly gaining traction, which we continue to believe will ultimately have a sustained positive impact on the demand for ethanol. Net exports of ethanol continue to be a positive factor for the industry. According to the RFA, United States exports of ethanol rose 35% to approximately 836 million gallons in 2014 as compared to approximately 617 million gallons in 2013. We expect United States exports to further increase in 2015 as Brazil migrates to 27% blend levels, strong demand from Canada persists and Asia and other parts of the world continue to draw exports from the United States.
Ethanol prices in the Western United States have typically been $0.20 per gallon higher than in the Midwest due to the freight costs of delivering ethanol from Midwest production facilities. For 2014, however, ethanol prices in the Western United States averaged $0.32 per gallon higher than ethanol prices in the Midwest due to rail logistics challenges and weather conditions during the winter which constrained the flow of ethanol and co-products from the Midwest to the markets in which we operate. Thus far in 2015, there have been fewer rail logistics challenges and weather-related conditions resulting in lower premiums that have largely normalized as of the filing of this report.
Growth in Chinese import demand for DDGS from the United States resulted in premium prices in the second half of 2013 and first half of 2014. Chinese demand slowed significantly in the third quarter of 2014 due to the imposition of import restrictions, resulting in significant declines in domestic DDGS and WDG prices. DDGS and WDG prices rebounded in the fourth quarter of 2014 as China eased import restrictions for distillers grains, reopening a lucrative market for this co-product. We expect that demand from China for DDGS will continue and that WDG prices will better align with the prices of corn and other competing products.
From 2010 through 2013, we issued in various financing transactions warrants to purchase shares of our common stock. The warrants were initially recorded at their fair values, which are adjusted quarterly, generally resulting in non-cash expenses or income if the market price of our common stock increases or decreases, respectively, during the period. Due to the substantial increase in the market price of our common stock in the first quarter of 2014 and because the exercise prices of these warrants were, as of March 31, 2014, well below the market price of our common stock, the fair values of the warrants and the related non-cash expenses were significantly higher in the first quarter and for the entire year than in the comparable prior periods in 2013, which resulted in unusually large non-cash expenses for those periods. These fair value adjustments will continue in future periods until all of our warrants are exercised or expire. These adjustments will generally reduce our net income or increase our net loss if the market price of our common stock increases from the prior quarter through the date of a warrant’s exercise, if exercised during the quarter, or if our common stock increases on a quarter over quarter basis for warrants outstanding at the end of a quarter. Conversely, the adjustments will generally increase our net income or reduce our net loss if the market price of our common stock declines in these scenarios. Since January 1, 2014, we have processed warrant exercises for approximately 6.4 million shares of our common stock. We expect that these warrant exercises will reduce our GAAP earnings volatility in future quarters as the equity roll amount of warrants marked to fair value has declined significantly.
We began producing and selling corn oil at our Magic Valley and Stockton facilities in June 2013 and October 2013, respectively, allowing us to diversify our revenue and providing immediate incremental gross profit. We are currently producing corn oil in meaningful amounts at both facilities and plan to complete the implementation of corn oil production technology at the remaining two Pacific Ethanol Plants by mid-2015. We have also implemented advanced grinding technologies at our Magic Valley and Stockton facilities and will evaluate when and to what extent these technologies should be implemented at the remaining two Pacific Ethanol Plants.
We continue to focus on increasing operating efficiencies and improving yields at the Pacific Ethanol Plants. To this end, we installed yield-enhancing fine grind technologies at our Stockton and Magic Valley facilities, allowing us to increase yields by increasing available starch for conversion. This technology also may allow us to produce cellulosic corn ethanol. Based on expected production margins, each 1% improvement in production yields results in approximately $3.0 million in additional annual gross profit when operating at our full production capacity of 200 million gallons.
| 34 |
In 2014, we made $13.3 million in capital expenditures, primarily related to the Pacific Ethanol Plants, and we have approved a further capital expenditure budget to invest up to an additional $30.0 million in the Pacific Ethanol Plants over the next year to further improve efficiencies, diversify feedstock, implement our advanced biofuels initiatives and implement cogeneration technologies to displace purchased electricity by converting waste gas from ethanol production and natural gas into electricity and steam. Our goal with these investments is to achieve a $0.05 to $0.06 per gallon improvement in annual operating earnings, which would equal approximately $10 million to $12 million in additional annual operating earnings at expected production margins when operating at our full production capacity.
The regulatory environment continues to support the long-term demand for renewable fuels. California’s Low-Carbon Fuel Standard requires refiners to reduce the carbon intensity of their fuels by 10% between 2011 and 2020, which we believe is an aggressive requirement that will necessitate a significant amount of low-carbon fuel to displace gasoline in the California fuel supply. Over the past year, the California Air Resources Board has engaged in a comprehensive process to re-adopt California’s Low-Carbon Fuel Standard for transportation fuels through 2030 and to apply aggressive new carbon intensity reduction targets for the final 10 years. In early March 2015, the California Air Resources Board staff held a public hearing on the proposed final rule. We expect formal approval of the rule during the summer of 2015 and expect the revised program to begin January 1, 2016. We believe the revised program will be beneficial as we produce among the lowest carbon intensity ethanol commercially available, and we receive a premium for the fuel we sell into the California marketplace, which we expect to increase as the compliance curve steepens beginning in 2016. In 2014, we entered into an arrangement to sell CO2 generated from our Columbia plant through a liquefaction and dry ice processing facility under construction adjacent to our plant. We expect to commence CO2 sales by the end of the first quarter of 2015.
We recently were awarded a $3.0 million matching grant from the California Energy Commission to develop a sorghum feedstock program collaboratively with Chromatin, Inc., California State University, Fresno’s Center for Irrigation Technology, and the Kearney Agricultural Research and Extension Center. This undertaking also includes the California In-State Sorghum Program to support a lasting expansion in California’s ability to produce low-carbon ethanol from in-state feedstock that meets both the renewable fuel and greenhouse gas reduction goals stipulated under the national RFS and California’s Low-Carbon Fuel Standard.
We continue to pursue production of advanced biofuels at the Pacific Ethanol Plants. To this end, we are in the project development phase with Sweetwater Energy to acquire cellulosic industrial sugars. We expect this project will take at least two years. We are also working with CellunatorsTM technology to enable the release of cellulosic sugars from corn kernel fibers which, when released through an appropriate enzyme for commercial production, will allow us to produce cellulosic ethanol for up to 2.0% of our overall production at a plant that uses the technology. We are also running a pilot program for anaerobic digestion at our Stockton facility to substitute biogas for natural gas for the production of advanced biofuels. In addition, our Magic Valley plant is well situated to add new facilities enabling ethanol production from wheat straw and we are evaluating the feasibility of a cellulosic project of this nature at this facility. Finally, we are analyzing various co-generation configurations, particularly at our California plants where energy prices are high and we receive a low-carbon premium for the ethanol we produce and sell into the California market.
Our goals for 2015 include completing our proposed merger with Aventine and efficiently integrating our two companies, and continuing to reinvest in our ethanol production business through initiatives focused on further improving operating efficiencies and yields at the Pacific Ethanol Plants, diversifying our feedstock, creating new revenue streams and furthering our advanced biofuels initiatives, all of which are directed at expanding our share of the renewable fuels market and delivering long-term profitable growth.
| 35 |
2014 Financial Performance Summary
Consolidation
We consolidate PE Op Co.’s financial results due to the nature of our ownership in and control over PE Op Co. However, since we do not wholly-own PE Op Co., we must adjust our consolidated net income (loss) for the income (loss) attributed to PE Op Co.’s other owners. This adjustment results in net income (loss) attributed to Pacific Ethanol, Inc. See “—Results of Operations—Accounting for the Results of PE Op Co.” below.
Summary
Our consolidated net sales increased by 22%, or $199.0 million, to $1,107.4 million for 2014 from $908.4 million for 2013. Our net income available to common stockholders increased by $22.0 million to net income of $20.0 million for 2014 from a net loss of $2.0 million for 2013.
Factors that contributed to our results of operations for 2014 include:
| · | Net sales. The increase in our net sales for 2014 as compared to 2013 was primarily due to the following combination of factors: |
| o | Higher production and marketing sales volumes. Our net sales for the period increased due to increases in both production and third party gallons sold. Our production sales volume of ethanol increased 23% to 183.5 million gallons for 2014 from 149.7 million gallons for 2013 and our third party sales volume increased 25% to 329.7 million gallons for 2014 from 264.2 million gallons for 2013. We increased production sales volume due to the restart of our Madera plant in April 2014 and due to higher industry-wide corn crush margins resulting from lower corn costs and tighter supplies of ethanol relative to demand. Corn crush margins are determined based on the difference between ethanol and corn prices. |
| o | Lower ethanol sales prices. Higher production and marketing sales volumes were partially offset by a decrease in our average ethanol sales price by 4% to $2.48 per gallon for 2014 as compared to $2.59 per gallon for 2013. |
| · | Gross margin. Our gross margin increased significantly to 9.8% for 2014 from 3.6% for 2013. The improvement in our gross margin was primarily the result of higher corn crush margins at the Pacific Ethanol Plants for most of the year due to lower corn costs relative to ethanol sales prices. |
| · | Selling, general and administrative expenses. Our selling, general and administrative expenses, or SG&A, increased by $3.1 million to $17.1 million for 2014, as compared to $14.0 million for 2013, primarily as a result of higher cash and noncash compensation expenses and professional fees. |
| · | Fair value adjustments and warrant inducements. Warrants we issued over the past few years are recorded at fair value, updated with quarterly adjustments for changes in their fair values and warrant inducements, resulting in a significant expense of $37.5 million for 2014 as compared to $1.0 million for 2013. This expense is primarily due to the significant amount by which the price of our common stock, which increased significantly in 2014, exceeded the exercise prices of our warrants. |
| 36 |
| · | Interest expense. Our interest expense decreased by $6.2 million to $9.4 million for 2014 from $15.7 million for 2013. This decrease is primarily due to decreased average debt balances as we paid off $70.8 million in consolidated debt during 2014. |
| · | Loss on extinguishments of debt. Our loss on extinguishments of debt decreased by $0.7 million to $2.4 million for 2014 from $3.0 million for 2013. The loss in 2014 related to the early retirement of our PE Op Co. debt and the loss in 2013 was primarily related to the retirement of our senior convertible notes. |
| · | Provision for income taxes. In 2014, we earned $41.1 million in net income before provision for income taxes, requiring us to record a provision for income taxes of $15.1 million for 2014. |
Sales and Margins
We generate sales by marketing all the ethanol produced by the Pacific Ethanol Plants, all the ethanol produced by two other ethanol producers in the Western United States and ethanol purchased from other third-party suppliers throughout the United States. We also market ethanol co-products, including WDG and corn oil, for the Pacific Ethanol Plants.
Our profitability is highly dependent on various commodity prices, including the market prices of ethanol, corn and natural gas.
Our average ethanol sales price decreased by 4.2% to $2.48 per gallon in 2014 from $2.59 per gallon in 2013. However, the average price of ethanol, as reported by the CBOT, decreased by 8.0% to $2.07 per gallon for 2014 from $2.25 per gallon for 2013.
Our average cost of corn decreased in 2014 as compared to 2013, positively impacting our corn crush margins. Specifically, our average cost of corn decreased by 26% to $5.45 per bushel for 2014 from $7.32 per bushel for 2013. This decrease is commensurate with the decline in the average price of corn as reported by the CBOT.
This disparity between our ethanol sales price per gallon and the CBOT average reflects both the additional basis costs for West Coast delivery of ethanol as well as the premiums we receive by selling lower-carbon intensity ethanol in the Western United States. Ethanol prices in the Western United States were also higher than ethanol prices in the Midwest due to weather conditions in the first quarter of 2014 and ongoing rail logistics challenges which constrained the flow of ethanol and co-products from the Midwest to the markets in which we operate.
We have three principal methods of selling ethanol: as a merchant, as a producer and as an agent. See “—Critical Accounting Policies—Revenue Recognition” below.
When acting as a merchant or as a producer, we generally enter into sales contracts to ship ethanol to a customer’s desired location. We support these sales contracts through purchase contracts with several third-party suppliers or through our own production. We manage the necessary logistics to deliver ethanol to our customers either directly from a third-party supplier or from our inventory via truck or rail. Our sales as a merchant or as a producer expose us to significant price risks resulting from potential fluctuations in the market price of ethanol and corn. Our exposure varies depending on the magnitude of our sales and purchase commitments compared to the magnitude of our existing inventory, as well as the pricing terms—such as market index or fixed pricing—of our contracts. We seek to mitigate our exposure to price risks by implementing appropriate risk management strategies.
| 37 |
When acting as an agent for third-party suppliers, we conduct back-to-back purchases and sales in which we match ethanol purchase and sale contracts of like quantities and delivery periods. When acting in this capacity, we receive a predetermined service fee and have little or no exposure to price risks resulting from potential fluctuations in the market price of ethanol. For these sales, we record the marketing fee as net sales.
We believe that our gross profit margins depend primarily on five key factors:
| · | the market price of ethanol, which we believe is impacted by the degree of competition in the ethanol market; the price of gasoline and related petroleum products; and government regulation, including government mandates; |
| · | the market price of key production input commodities, including corn and natural gas; |
| · | the market price of co-products, including WDG and corn oil; |
| · | our ability to anticipate trends in the market price of ethanol, co-products, and key input commodities and implement appropriate risk management and opportunistic strategies; and |
| · | the proportion of our sales of ethanol produced at the Pacific Ethanol Plants to our sales of ethanol produced by unrelated third-parties. |
We seek to optimize our gross profit margins by anticipating the factors above and, when resources are available, implementing hedging transactions and taking other actions designed to limit risk and address these factors. For example, we may seek to decrease inventory levels in anticipation of declining ethanol prices and increase inventory levels in anticipation of rising ethanol prices. We may also seek to alter our proportion or timing, or both, of purchase and sales commitments. Furthermore, we may diversify our ethanol feedstock to lower our average costs and/or increase our ethanol sales prices from premiums for low-carbon intensity rated ethanol.
Our limited resources to act upon the anticipated factors described above and/or our inability to anticipate these factors or their relative importance, and adverse movements in the factors themselves, could result in declining or even negative gross profit margins over certain periods of time. Our ability to anticipate these factors or favorable movements in these factors may enable us to generate above-average gross profit margins. However, given the difficulty associated with successfully forecasting any of these factors, we are unable to estimate our future gross profit margins.
Results of Operations
Accounting for the Results of PE Op Co.
Since October 6, 2010, our consolidated financial statements have included the financial statements of PE Op Co., which in turn include the financial statements of the Plant Owners. On October 6, 2010, we purchased a 20% ownership interest in PE Op Co., which gave us the single largest equity position in PE Op Co. Based on our ownership interest as well as our asset management and marketing agreements with PE Op Co., we determined that, beginning on October 6, 2010, we were the primary beneficiary of PE Op Co., and as such, we consolidated PE Op Co.’s financial results with our financial results. As of December 31, 2014, we held a 96% ownership interest in PE Op Co.
| 38 |
Selected Financial Information
The following selected financial information should be read in conjunction with our consolidated financial statements and notes to our consolidated financial statements included elsewhere in this report, and the other sections of “Management’s Discussion and Analysis of Financial Condition and Results of Operations” contained in this report.
Certain performance metrics that we believe are important indicators of our results of operations include:
| Years Ended December 31, | Percentage Change | Percentage Change | ||||||||||||||||||
| 2014 | 2013 | 2012 | 2014 vs 2013 | 2013 vs 2012 | ||||||||||||||||
| Production gallons sold (in millions) | 183.5 | 149.7 | 140.6 | 22.6 | % | 6.5 | % | |||||||||||||
| Third party gallons sold (in millions) | 329.7 | 264.2 | 300.2 | 24.8 | % | (12.0 | )% | |||||||||||||
| Total gallons sold (in millions) | 513.2 | 413.9 | 440.8 | 24.0 | % | (6.1 | )% | |||||||||||||
| Average sales price per gallon | $ | 2.48 | $ | 2.59 | $ | 2.45 | (4.2 | )% | 5.7 | % | ||||||||||
| Corn cost per bushel—CBOT equivalent | $ | 4.21 | $ | 5.72 | $ | 6.89 | (26.4 | )% | (17.0 | )% | ||||||||||
| Average basis(1) | $ | 1.24 | $ | 1.60 | $ | 1.06 | (22.5 | )% | 50.9 | % | ||||||||||
| Delivered cost of corn | $ | 5.45 | $ | 7.32 | $ | 7.95 | (25.5 | )% | (7.9 | )% | ||||||||||
| Co-product revenues as % of delivered cost of corn(2) | 32.5% | 29.6% | 26.8% | 9.8 | % | 10.4 | % | |||||||||||||
| Average CBOT ethanol price per gallon | $ | 2.07 | $ | 2.25 | $ | 2.31 | (8.0 | )% | (2.6 | )% | ||||||||||
| Average CBOT corn price per bushel | $ | 4.16 | $ | 5.78 | $ | 6.95 | (28.0 | )% | (16.8 | )% | ||||||||||
| (1) | Corn basis represents the difference between the immediate cash price of delivered corn and the future price of corn for Chicago delivery. |
| (2) | Co-product revenues as a percentage of delivered cost of corn shows our yield based on sales of co-products, including WDG and corn oil, generated from ethanol we produced. |
Year Ended December 31, 2014 Compared to the Year Ended December 31, 2013
| Results as a Percentage | ||||||||||||||||||||||||
| Dollar | Percentage | of Net Sales for the | ||||||||||||||||||||||
| Years Ended | Change | Change | Years Ended | |||||||||||||||||||||
| December 31, | Favorable | Favorable | December 31, | |||||||||||||||||||||
| 2014 | 2013 | (Unfavorable) | (Unfavorable) | 2014 | 2013 | |||||||||||||||||||
| (dollars in thousands) | ||||||||||||||||||||||||
| Net sales | $ | 1,107,412 | $ | 908,437 | $ | 198,975 | 21.9 | % | 100.0 | % | 100.0 | % | ||||||||||||
| Cost of goods sold | 998,927 | 875,507 | (123,420 | ) | (14.1 | )% | 90.2 | % | 96.4 | % | ||||||||||||||
| Gross profit | 108,485 | 32,930 | 75,555 | 229.4 | % | 9.8 | % | 3.6 | % | |||||||||||||||
| Selling, general and administrative expenses | 17,108 | 14,021 | (3,087 | ) | (22.0 | )% | 1.5 | % | 1.5 | % | ||||||||||||||
| Income from operations | 91,377 | 18,909 | 72,468 | 383.2 | % | 8.3 | % | 2.1 | % | |||||||||||||||
| Fair value adjustments and warrant inducements | (37,532 | ) | (1,013 | ) | (36,519 | ) | (3,605.0 | )% | (3.4 | )% | (0.1 | )% | ||||||||||||
| Interest expense, net | (9,438 | ) | (15,671 | ) | 6,233 | 39.8 | % | (0.9 | )% | (1.7 | )% | |||||||||||||
| Loss on extinguishments of debt | (2,363 | ) | (3,035 | ) | 672 | 22.1 | % | (0.2 | )% | (0.3 | )% | |||||||||||||
| Other expense, net | (905 | ) | (352 | ) | (553 | ) | (157.1 | )% | (0.1 | )% | 0.0 | % | ||||||||||||
| Income (loss) before provision for income taxes | 41,139 | (1,162 | ) | 42,301 | NM | 3.7 | % | (0.1 | )% | |||||||||||||||
| Provision for income taxes | 15,137 | – | (15,137 | ) | NM | 1.4 | % | – | ||||||||||||||||
| Consolidated net income (loss) | 26,002 | (1,162 | ) | 27,164 | NM | 2.3 | % | (0.1 | )% | |||||||||||||||
| Net (income) loss attributed to noncontrolling interests | (4,713 | ) | 381 | (5,094 | ) | NM | (0.4 | )% | 0.0 | % | ||||||||||||||
| Net income (loss) attributed to Pacific Ethanol, Inc. | $ | 21,289 | $ | (781 | ) | $ | 22,070 | NM | 1.9 | % | (0.1 | )% | ||||||||||||
| Preferred stock dividends | (1,265 | ) | (1,265 | ) | – | –% | (0.1 | )% | (0.1 | )% | ||||||||||||||
| Income (loss) available to common stockholders | $ | 20,024 | $ | (2,046 | ) | $ | 22,070 | NM | 1.8 | % | (0.2 | )% | ||||||||||||
| 39 |
Net Sales
The increase in our net sales for 2014 as compared to 2013 was primarily due to an increase in our total gallons sold, which was partially offset by a decline in our average sales price per gallon.
Net sales of ethanol increased by $206.2 million, or 26%, to $987.9 million for 2014 as compared to $781.7 million for 2013. Our total volume of ethanol gallons sold increased by 99.3 million gallons, or 24%, to 513.2 million gallons for 2014 as compared to 413.9 million gallons for 2013. Of the additional 99.3 million gallons of ethanol sold in 2014, an aggregate of 97.8 million gallons were attributable to our sales as a producer or a merchant and 1.5 million gallons were attributable to our sales as an agent. At our average sales price per gallon of $2.48 for 2014, we generated $242.5 million in additional net sales from the 97.8 million additional gallons of ethanol sold as a producer or a merchant in 2014 as compared to 2013. The 1.5 million additional gallons of ethanol sold as an agent had an immaterial impact on our net sales. The decline of $0.11, or 4.2%, in our average sales price per gallon in 2014 as compared to 2013 reduced our net sales by $33.1 million.
Net sales of co-products decreased by $7.2 million, or 6%, to $111.5 million for 2014 as compared to $118.7 million for 2013. Our total volume of WDG sold increased by 0.17 million tons to 1.50 million tons for 2014 from 1.33 million tons for 2013. At our average sales price per ton of $72.62 for 2014, we generated $12.3 million in additional net sales from the 0.17 million additional tons of WDG sold in 2014 as compared to 2013. However, the decline of $14.61, or 16.7%, in our average sales price per ton in 2014 as compared to 2013 fully offset the increase in our net sales resulting from higher sales volumes, reducing our net sales by $19.4 million. Although net sales of our other co-products increased in 2014 as compared to 2013, we believe the overall changes in sales volumes and prices of those co-products were immaterial to our net sales for 2014.
We increased both production and third party gallons sold, and our volume of co-products sold, for 2014 as compared to 2013. The increases in our production gallons and third party gallons sold are primarily due to increased production rates at the Pacific Ethanol Plants and third party supplier plants, respectively, including as a result of the restart of production at our Madera plant. The increase in our volume of co-products sold is due to increased production at the Pacific Ethanol Plants, including as a result of the restart of production at our Madera plant. We and our third party suppliers increased production rates due to higher industry-wide corn crush margins resulting from lower corn costs and relatively higher ethanol prices due to tighter ethanol supplies relative to demand, especially in the Western United States due to weather conditions in the first quarter of 2014 and ongoing rail logistics challenges which constrained the flow of ethanol and co-products from the Midwest to the markets in which we operate. In addition, we expanded our customer base and our sales within the regions we cover which contributed to our higher third party gallons sold.
Our average sales price per gallon decreased 4.2% to $2.48 for 2014 compared to our average sales price per gallon of $2.59 for 2013. The average CBOT ethanol price per gallon, however, declined 8% to $2.07 for 2014 compared to an average CBOT sales price per gallon of $2.25 for 2013.
This disparity between our average ethanol sales price per gallon and the CBOT average reflects both the additional basis costs for West Coast delivery of ethanol as well as the premiums we receive by selling lower-carbon intensity ethanol in the Western United States. As noted above, ethanol prices in the Western United States were also higher than ethanol prices in the Midwest due to weather conditions in the first quarter of 2014 and ongoing rail logistics challenges which constrained the flow of ethanol and co-products from the Midwest to the markets in which we operate.
| 40 |
Cost of Goods Sold and Gross Profit
Our gross profit improved significantly to a record $108.5 million for 2014 from $32.9 million for 2013. Our gross margin also improved significantly to 9.8% for 2014 from 3.6% for the same period in 2013. Our gross profit and gross margins increased primarily due to the impact of our production gallons sold, in particular, due to significantly improved corn crush margins, predominantly related to lower corn costs and tighter ethanol supplies relative to demand as well as higher ethanol prices in the Western United States due to weather conditions in the first quarter of 2014 and rail logistics challenges which constrained the flow of ethanol and co-products from the Midwest to the markets in which we operate. Crush and commodity margins reflect ethanol and co-product sales prices relative to ethanol production inputs such as corn and natural gas. Our ongoing plant efficiency and yield improvement initiatives also positively impacted our margins.
Of the additional $75.6 million in gross profit for 2014 as compared to 2013, $74.4 million in additional gross profit resulted from our total production gallons sold. Our production gallons sold increased by 33.8 million gallons in 2014 as compared to 2013. Of the $74.4 million in additional gross profit resulting from our total production gallons sold, $57.4 million in gross profit is attributable to our improved gross margins and $17.0 million in gross profit is attributable to the 33.8 million gallon increase in production gallons sold in 2014 as compared to 2013.
Selling, General and Administrative Expenses
Our SG&A increased $3.1 million to $17.1 million for 2014 as compared to $14.0 million for the same period in 2013. The increase in SG&A is primarily due to an increase in compensation costs of $1.0 million due to incentive compensation tied to our profitability and an increase in professional fees of $1.8 million due to increased corporate and plant activity, including $0.7 million related to our proposed merger with Aventine.
Fair Value Adjustments and Warrant Inducements
We issued certain warrants in various financing transactions from 2010 through 2013. These warrants were initially recorded at fair value and are adjusted quarterly. As a result of quarterly adjustments to their fair values and warrant inducements, we recorded an expense of $37.5 million for 2014 and $1.0 million for 2013.
The significant expense and changes in fair value in 2014 are primarily due to the increased number of warrants issued in the three months ended March 31, 2013 and the volatility in the market price of our common stock from period to period. The substantial change in fair value for 2014 occurred because the exercise prices of our warrants were well below the market price of our common stock throughout the year, most notably at March 31, 2014. At December 31, 2013, the market price of our common stock was $5.09 per share and our outstanding warrants had a weighted-average exercise price of $7.27 per share. At March 31, 2014, the market price of our common stock had increased to $15.58 per share, and our outstanding warrants were in-the-money and had significant intrinsic value. At December 31, 2014, the market price of our common stock had declined slightly from the prior quarter to $10.33.
These fair value adjustments will continue in future periods until all of our warrants are exercised or expire. These adjustments will generally reduce our net income or increase our net loss if the market price of our common stock increases from the prior quarter through the date of a warrant’s exercise, if exercised during the quarter, or if our common stock increased on a quarter over quarter basis for warrants outstanding at the end of a quarter. Conversely, the adjustments will generally increase our net income or reduce our net loss if the market price of our common stock declines in these scenarios.
We paid an aggregate of $2.3 million and $0.8 million in cash to certain warrant holders as inducements to exercise their warrants in 2014 and 2013, respectively.
| 41 |
Interest Expense
Interest expense, net declined by $6.2 million to $9.4 million for 2014 from $15.7 million for 2013. The decrease in interest expense, net for these periods is primarily due to decreased average debt balances, partially offset by accelerations of debt discount and deferred financing fees of an aggregate of $2.1 million for 2014, due to the early retirement of the Plant Owners’ debt and our senior unsecured notes.
Loss on Extinguishments of Debt
We extinguished certain PE Op Co. debt by paying $2.4 million in cash in excess of the amount of the debt, and as such, recorded a loss on extinguishments of debt. We retired a total of $70.8 million in debt during 2014, eliminating all parent level debt and reducing our consolidated third-party debt at the Pacific Ethanol Plant level to $17.0 million.
Other Expense, Net
Other expense, net increased by $0.5 million to $0.9 million for 2014 from $0.4 million for 2013. The increase in other expense, net is primarily due to our significantly reduced debt balances in 2014.
Provision for Income Taxes
In 2014, we generated income subject to income tax. Our fair value adjustments and warrant inducements are not tax deductible and thus resulted in larger taxable income as compared to reported income before our provision for income taxes. On a cash basis, we applied our net operating loss carryforwards to a portion of our taxable income for the year. Our remaining Federal net operating loss carryforwards of $28.3 million are limited on an annual basis to approximately $3.0 million for the next two years and $1.5 million for the following 15 years.
Net (Income) Loss Attributed to Noncontrolling Interests
Net (income) loss attributed to noncontrolling interests relates to our consolidated treatment of PE Op Co., and represents the noncontrolling interest of other owners in PE Op Co.’s income or losses. We consolidated PE Op Co.’s financial results for the periods presented, however, because we owned less than 100% of PE Op Co. during the periods, we accordingly reduced our net income (loss) for the noncontrolling interests, which represents the remaining ownership interests that we do not own. We increased our ownership interest in PE Op Co. to 96% during 2014. In early 2013, when we owned a smaller percentage of PE Op Co., gross margins and profits were lower than in the latter part of the year when we owned a higher percentage of PE Op Co. As a result, income attributed to the noncontrolling interests was lower and income attributed to us was higher as we owned more of PE Op Co. during periods of higher gross margins and profits.
Preferred Stock Dividends
Shares of our Series B Preferred Stock are entitled to quarterly cumulative dividends payable in arrears in an amount equal to 7% per annum of the purchase price per share of the Series B Preferred Stock. We accrued and paid in cash dividends of $1.3 million for each of 2014 and 2013 in respect of our Series B Preferred Stock.
| 42 |
Year Ended December 31, 2013 Compared to the Year Ended December 31, 2012
| Results as a Percentage | ||||||||||||||||||||||||
| Dollar | Percentage | of Net Sales for the | ||||||||||||||||||||||
| Years Ended | Variance | Variance | Years Ended | |||||||||||||||||||||
| December 31, | Favorable | Favorable | December 31, | |||||||||||||||||||||
| 2013 | 2012 | (Unfavorable) | (Unfavorable) | 2013 | 2012 | |||||||||||||||||||
| (dollars in thousands) | ||||||||||||||||||||||||
| Net sales | $ | 908,437 | $ | 816,044 | $ | 92,393 | 11.3 | % | 100.0 | % | 100.0 | % | ||||||||||||
| Cost of goods sold | 875,507 | 835,568 | (39,939 | ) | (4.8 | )% | 96.4 | % | 102.4 | % | ||||||||||||||
| Gross profit (loss) | 32,930 | (19,524 | ) | 52,454 | NM | 3.6 | % | (2.4 | )% | |||||||||||||||
| Selling, general and administrative expenses | 14,021 | 12,141 | (1,880 | ) | (15.5 | )% | 1.5 | % | 1.5 | % | ||||||||||||||
| Income (loss) from operations | 18,909 | (31,665 | ) | 50,574 | NM | 2.1 | % | (3.9 | )% | |||||||||||||||
| Fair value adjustments and warrant inducements | (1,013 | ) | 1,954 | (2,967 | ) | (151.8 | )% | (0.1 | )% | 0.2 | % | |||||||||||||
| Interest expense, net | (15,671 | ) | (13,049 | ) | (2,622 | ) | (20.1 | )% | (1.7 | )% | (1.6 | )% | ||||||||||||
| Loss on extinguishments of debt | (3,035 | ) | – | (3,035 | ) | NM | (0.3 | )% | – | |||||||||||||||
| Other expense, net | (352 | ) | (595 | ) | 243 | 40.8 | % | 0.0 | % | (0.1 | )% | |||||||||||||
| Loss before provision for income taxes and noncontrolling interest | (1,162 | ) | (43,355 | ) | 42,193 | 97.3 | % | (0.1 | )% | (5.3 | )% | |||||||||||||
| Provision for income taxes | – | – | – | – | – | – | ||||||||||||||||||
| Consolidated net loss | (1,162 | ) | (43,355 | ) | 42,193 | 97.3 | % | (0.1 | )% | (5.3 | )% | |||||||||||||
| Net loss attributed to noncontrolling interests | 381 | 24,298 | (23,917 | ) | (98.4 | )% | 0.0 | % | 3.0 | % | ||||||||||||||
| Net loss attributed to Pacific Ethanol, Inc. | $ | (781 | ) | $ | (19,057 | ) | $ | 18,276 | 95.9 | % | (0.1 | )% | (2.3 | )% | ||||||||||
| Preferred stock dividends | (1,265 | ) | (1,268 | ) | 3 | 0.2 | % | (0.1 | )% | (0.2 | )% | |||||||||||||
| Loss available to common stockholders | $ | (2,046 | ) | $ | (20,325 | ) | $ | 18,279 | 89.9 | % | (0.2 | )% | (2.5 | )% | ||||||||||
Net Sales
The increase in our net sales for 2013 as compared to 2012 was primarily due to an increase in our total production gallons sold coupled with an increase in our average sales price per gallon.
Net sales of ethanol increased by $82.2 million, or 12%, to $781.7 million for 2013 as compared to $699.5 million for 2012. Our total volume of ethanol gallons sold declined by 26.9 million gallons, or 6.1%, to 413.9 million gallons for 2013 as compared to 440.8 million gallons for 2012. Of the 26.9 million fewer gallons of ethanol sold in 2013, an aggregate of 16.4 million gallons were attributable to our sales as a producer or a merchant and 10.5 million gallons were attributable to our sales as an agent. At our average sales price per gallon of $2.59 for 2013, we generated $42.5 million in additional net sales from the 16.4 million additional gallons of ethanol sold as a producer or a merchant in 2013 as compared to 2012. The 10.5 million additional gallons of ethanol sold as an agent had an immaterial impact on our net sales. The increase of $0.14, or 5.7%, in our average sales price per gallon in 2013 as compared to 2012 increased our net sales by $39.8 million.
Net sales of co-products increased by $8.0 million, or 7%, to $118.7 million for 2013 as compared to $110.7 million for 2012. Our total volume of WDG sold increased by 0.08 million tons to 1.33 million tons for 2013 from 1.25 million tons for 2012. At our average sales price per ton of $87.23 for 2013, we generated $7.0 million in additional net sales from the 0.08 million additional tons of WDG sold in 2013 as compared to 2012. In addition, the increase of $1.37, or 1.6%, in our average sales price per ton in 2013 as compared to 2012 increased our net sales by $1.7 million. Although net sales of our other co-products increased in 2013 as compared to 2012, we believe the overall changes in sales volumes and prices of those co-products were immaterial to our net sales for 2013.
Total volume of production gallons sold increased 6.5%, or 9.1 million gallons, to 149.7 million gallons for 2013 as compared to 140.6 million gallons for 2012. The increase in production gallons sold is primarily due to our increased production rates at the Pacific Ethanol Plants. We increased production rates due to higher industry-wide corn crush margins resulting from lower corn costs and higher ethanol prices due to tighter ethanol supply relative to demand. Third-party gallons sold, however, decreased by 12.0%, or 36.0 million gallons, to 264.2 million gallons for 2013 as compared to 300.2 million gallons for 2012. The decrease in third-party gallons sold is primarily due to decreased sales under our third-party ethanol marketing arrangements as our marketing agreement with Front Range Energy expired during the year. Although our total combined volume of production and third party gallons sold decreased in 2013 as compared to 2012, our net sales for the period increased because the impact of the increase in our production gallons sold, which are recorded at gross sales prices, was greater than the impact of the decrease in third party gallons sold, which are recorded at gross or net sales prices, depending on the contract terms.
Our average sales price per gallon increased 5.7% to $2.59 for 2013 from $2.45 for 2012, even though the average CBOT ethanol price per gallon decreased 2.6% to $2.25 for 2013 from $2.31 for 2012. This disparity between our ethanol sales price per gallon and the CBOT average reflects both the additional basis costs for West Coast delivery of ethanol as well as the premium we receive by selling lower carbon intensity ethanol in the Western United States.
| 43 |
Cost of Goods Sold and Gross Profit (Loss)
Our gross profit (loss) improved significantly to a gross profit of $32.9 million for 2013 from a gross loss of $19.5 million for 2012 primarily due to higher corn crush margins realized at the Pacific Ethanol Plants, predominantly related to lower corn costs and tighter ethanol supply relative to demand. Our gross margin improved substantially to positive 3.6% for 2013 as compared to negative 2.4% for 2012.
Of the additional $52.4 million in gross profit for 2013 as compared to 2012, $47.7 million in additional gross profit resulted from our total production gallons sold. Our production gallons sold increased by 9.1 million gallons in 2013 as compared to 2012. Of the $47.7 million in additional gross profit resulting from our total production gallons sold, $46.6 million in gross profit is attributable to our improved gross margins and $1.1 million in gross profit is attributable to the 9.1 million gallon increase in production gallons sold in 2013 as compared to 2012.
Selling, General and Administrative Expenses
Our SG&A remained consistent at 1.5% of net sales, but increased in absolute terms by $1.9 million to $14.0 million for 2013 as compared to $12.1 million for 2012. The increase in SG&A is primarily due to the following factors:
| · | an increase in noncash compensation expense of $0.9 million due to awards of restricted stock and options to our employees and members of our board of directors during the period; |
| · | an increase in cash compensation expense of $0.5 million due to year-end compensation expense primarily driven by company performance; |
| · | an increase in professional fees of $0.5 million due to non-capitalized expenses associated with the issuance of our senior unsecured notes in January 2013; |
| · | an increase in other professional fees of $0.2 million due to expenses related to our special meeting of stockholders in May 2013; and |
| · | an increase in regulatory fees of $0.5 million due to increased production activity and projects. |
These increases were partially offset by:
| · | a decrease in lease expense of $0.5 million due to the expiration of certain lease agreements; and |
| · | a decrease in depreciation and amortization of intangibles of $0.3 million. |
Fair Value Adjustments and Warrant Inducements
We issued certain warrants in various transactions from 2010 through 2013. In addition, in 2013, we issued subordinated convertible notes. The warrants and conversion features associated with the convertible notes were originally recorded at fair value and are adjusted quarterly. As a result of quarterly adjustments to their fair values, we recorded an expense of $1.0 million for 2013 as compared to income of $2.0 million for 2012. This change in fair values is primarily due to the increased number of warrants issued in 2013, partially offset by the decline in fair values due to a decrease in the market price of our common stock at the end of each period as compared to the beginning of each period.
| 44 |
Interest Expense
Interest expense increased by $2.6 million to $15.7 million for 2013 from $13.0 million for 2012. The increase is primarily due to increased average debt balances, which included our senior notes, subordinated convertible notes and the term loans and credit facilities for the Plant Owners and Kinergy.
Loss on Extinguishments of Debt
Loss on extinguishments of debt was $3.0 million for 2013 as compared to no loss on extinguishments of debt for 2012. The increase is due to early conversions of our subordinated convertible notes into shares of our common stock at a discount to the prevailing market price of our common stock.
Other Expense, Net
Other expense decreased by $0.2 million to $0.4 million for 2013 from $0.6 million for 2012. The decrease in other expense is primarily due to a reduction in bank fees.
Net Loss Attributable to Noncontrolling Interests
Net loss attributed to noncontrolling interests relates to the consolidated treatment of PE Op Co., and represents the noncontrolling interests of other owners in PE Op Co.’s income or losses. We consolidated PE Op Co.’s financial results for the periods presented, however, because we owned less than 100% of PE Op Co. during the periods, we accordingly reduced our net loss for the noncontrolling interests, which represents the remaining ownership interests that we do not own. We increased our ownership interest in PE Op. Co. to 91% during 2013. In early 2013, when we owned a smaller percentage of PE Op Co., gross margins and profits were lower than in the later part of the year when we owned a higher percentage of PE Op Co. As a result, income attributed to the noncontrolling interests was lower and income attributed to us was higher as we owned more of PE Op Co. during periods of higher gross margins and profits.
Preferred Stock Dividends
Shares of our Series B Preferred Stock are entitled to quarterly cumulative dividends payable in arrears in an amount equal to 7% per annum of the purchase price per share of the Series B Preferred Stock. We accrued and paid in cash dividends of $1.3 million for each of 2013 and 2012 in respect to our Series B Preferred Stock.
Liquidity and Capital Resources
During 2014, we funded our operations primarily from cash on hand, cash flow from operations, proceeds from an equity offering, warrant exercises and borrowings under our credit facilities. Funds generated from these sources were also used to make debt payments, including prepayments, in the aggregate amount of $70.8 million, eliminating all parent level debt and reducing our consolidated third-party debt at the Pacific Ethanol Plant level to $17.0 million.
Our current available capital resources consist of cash on hand and amounts available for borrowing under Kinergy’s credit facility. In addition, the Plant Owners have credit facilities for use in the operations of the Pacific Ethanol Plants. We expect that our future available capital resources will consist primarily of our remaining cash balances, amounts available for borrowing, if any, under Kinergy’s credit facility, cash generated from Kinergy’s ethanol marketing business, fees paid under our asset management agreement relating to our operation of the Pacific Ethanol Plants, proceeds from warrant exercises and dividends, if any, in respect of our ownership interest in PE Op Co.
We believe that current and future available capital resources, revenues generated from operations, and other existing sources of liquidity, including our credit facilities, will be adequate to meet our anticipated working capital and capital expenditure requirements for at least the next twelve months.
| 45 |
Quantitative Year-End Liquidity Status
We believe that the following amounts provide insight into our liquidity and capital resources. The following selected financial information should be read in conjunction with our consolidated financial statements and notes to consolidated financial statements included elsewhere in this report, and the other sections of “Management’s Discussion and Analysis of Financial Condition and Results of Operations” contained in this report (dollars in thousands):
| December 31, | ||||||||||||
| 2014 | 2013 | % Change | ||||||||||
| Cash and cash equivalents | $ | 62,084 | $ | 5,151 | 1,105.3 | % | ||||||
| Current assets | $ | 139,551 | $ | 79,377 | 75.8 | % | ||||||
| Current liabilities | $ | 25,447 | $ | 28,216 | (9.8 | )% | ||||||
| Notes payable, current portion | $ | – | $ | 750 | (100.0 | )% | ||||||
| Notes payable, noncurrent portion | $ | 34,533 | $ | 98,408 | (64.9 | )% | ||||||
| Working capital | $ | 114,104 | $ | 51,161 | 123.0 | % | ||||||
| Working capital ratio | 5.48 | 2.81 | 95.0 | % | ||||||||
Change in Working Capital and Cash Flows
Working capital increased to $114.1 million at December 31, 2014 from $51.2 million at December 31, 2013 as a result of an increase in current assets of $60.2 million, consisting predominately of an increase in cash and cash equivalents, and a decrease in current liabilities. Cash and cash equivalents increased primarily as a result of operating cash flows of $88.3 million resulting from higher production volumes and significantly improved margins, cash exercises of our warrants in the aggregate of $43.7 million and an equity offering in April 2014 in which we raised net proceeds of $26.1 million, all of which were partially offset by debt related payments in the aggregate of $70.8 million as we prepaid significant portions of our outstanding indebtedness, and payments of $6.0 million to increase our ownership interest in our plants to 96%. The increase in current assets was partially offset by a decrease in inventories of $4.8 million due to timing of inventory balances at the end of the year. Current liabilities decreased primarily due to decreases in other current liabilities of $3.7 million, as our purchase liabilities under our beet sugar feedstock program have declined as we come to the conclusion of the program, partially offset by increases in trade accounts payable and accrued liabilities of $2.4 million resulting from higher sales volumes.
Cash provided by operating activities of $88.3 million resulted largely from consolidated net income of $26.0 million resulting from higher production volumes and significantly improved margins, as noted above, non-cash fair value adjustments of $35.3 million related to our outstanding warrants and the substantial increase in the market price of our common stock since December 31, 2013, and depreciation and amortization of $13.2 million.
Cash used in our investing activities of $19.3 million resulted from additions to property and equipment of $13.3 million attributable to our investments in plant enhancements and purchases of ownership interests in PE Op Co. of $6.0 million.
Cash used in our financing activities of $12.1 million resulted primarily from repayments of our senior unsecured notes and the Plant Owners’ borrowings of $70.8 million, principal payments on capital leases of $4.9 million, cash payments of dividends in respect of our Series B Preferred Stock of $3.5 million, and net payments on our Kinergy line of credit of $1.5 million, which were partially offset by proceeds received from warrant exercises of $43.7 million and from our equity offering in April 2014 of $26.1 million.
| 46 |
Kinergy Operating Line of Credit
Kinergy maintains an operating line of credit for an aggregate amount of up to $30.0 million. The credit facility expires on December 31, 2016. Interest accrues under the credit facility at a rate equal to (i) the three-month London Interbank Offered Rate (“LIBOR”), plus (ii) a specified applicable margin ranging from 2.00% to 3.00%. The credit facility’s monthly unused line fee is 0.50% of the amount by which the maximum credit under the facility exceeds the average daily principal balance. Payments that may be made by Kinergy to Pacific Ethanol as reimbursement for management and other services provided by Pacific Ethanol to Kinergy are limited under the terms of the credit facility to $1.1 million per fiscal quarter in 2015.
The credit facility also includes the accounts receivable of Pacific Ag. Products, LLC, or PAP, one of our indirect wholly-owned subsidiaries, as additional collateral. Payments that may be made by PAP to Pacific Ethanol as reimbursement for management and other services provided by Pacific Ethanol to PAP are limited under the terms of the credit facility to the extent that quarterly payments would result in PAP recording less than $0.1 million of net income in the quarter.
Kinergy and PAP are collectively required to generate aggregate earnings before interest, taxes, depreciation and amortization, or EBITDA, of $0.5 million, measured at the end of each calendar month, for each three calendar month period and EBITDA of $1.3 million, measured at the end of each calendar month, for each six calendar month period. Further, for all monthly periods, Kinergy and PAP must collectively maintain a fixed-charge coverage ratio (calculated as a twelve-month rolling EBITDA divided by the sum of interest expense, capital expenditures, principal payments of indebtedness, indebtedness from capital leases and taxes paid during such twelve-month rolling period) of at least 2.0 and are prohibited from incurring any additional indebtedness (other than specific intercompany indebtedness) or making any capital expenditures in excess of $0.1 million absent the lender’s prior consent. Kinergy and PAP’s obligations under the credit facility are secured by a first-priority security interest in all of their assets in favor of the lender. In December 2014, the terms of the above covenants were changed such that if the monthly average unused availability is in excess of $10.0 million and Kinergy maintains at least $6.0 million in excess availability during the quarter, that month’s EBITDA and fixed-charge coverage ratio covenants are not required to be met. Kinergy and PAP believe they are in compliance with these covenants.
The following table summarizes Kinergy’s financial covenants and actual results for the periods presented (dollars in thousands):
| Three Months Ended December 31, | Years Ended December 31, | |||||||||||||||
| 2014 | 2013 | 2014 | 2013 | |||||||||||||
| EBITDA Requirement – Three Months | $ | 500 | $ | 450 | $ | 500 | $ | 450 | ||||||||
| Actual | $ | 2,129 | $ | 3,252 | $ | 2,129 | $ | 3,252 | ||||||||
| Excess | $ | 1,629 | $ | 2,802 | $ | 1,629 | $ | 2,802 | ||||||||
| EBITDA Requirement – Six Months | $ | 1,300 | $ | 1,100 | $ | 1,300 | $ | 1,100 | ||||||||
| Actual | $ | 3,347 | $ | 4,131 | $ | 3,347 | $ | 4,131 | ||||||||
| Excess | $ | 2,047 | $ | 3,031 | $ | 2,047 | $ | 3,031 | ||||||||
| Fixed Charge Coverage Ratio Requirement | 2.00 | 2.00 | 2.00 | 2.00 | ||||||||||||
| Actual | 17.66 | 8.64 | 17.66 | 8.64 | ||||||||||||
| Excess | 15.66 | 6.64 | 15.66 | 6.64 | ||||||||||||
Pacific Ethanol has guaranteed all of Kinergy’s obligations under the credit facility. As of December 31, 2014, Kinergy had an available borrowing base under the credit facility of $30.0 million and an outstanding balance of $17.5 million.
| 47 |
Plant Owners’ Term Debt and Operating Lines of Credit
The Plant Owners’ debt as of December 31, 2014 consisted of a $32.5 million tranche A-1 term loan and a $26.3 million tranche A-2 term loan. Pacific Ethanol, Inc. holds $41.8 million of these term loans, which are eliminated in consolidation. The term debt requires monthly interest payments at a floating rate equal to the three-month LIBOR or the Prime Rate of interest, at the Plant Owners’ election, plus 10.0%. The revolving credit facilities require monthly interest payments at a floating rate equal to the three-month LIBOR or the Prime Rate of interest, at the Plant Owners’ election, plus 10.0% and 5.5% for the $19.5 million and $15.0 million facilities, respectively. At December 31, 2014, the average interest rate was approximately 11.0%. Repayments of principal are based on available free cash flow of the Plant Owners, until maturity, when all principal amounts are due.
As of December 31, 2014, the Plant Owners had no outstanding principal balances on their revolving credit facilities and an aggregate borrowing availability of $34.5 million.
All of the term loans and revolving credit facilities represent permanent financing and are secured by a perfected, first-priority security interest in all of the assets, including inventories and all rights, title and interest in all tangible and intangible assets, of the Plant Owners. The Plant Owners’ creditors do not have recourse to Pacific Ethanol, Inc.
Pacific Ethanol Debt
Senior Unsecured Notes
On January 11, 2013 we issued and sold $22.2 million in aggregate principal amount of senior unsecured notes and warrants to purchase an aggregate of 1.7 million shares of our common stock for aggregate net proceeds of $22.1 million. The warrants have an exercise price of $6.32 per share and expire in January 2018. As of the filing of this report, we have fully repaid these notes.
Note Payable to Related Party
We repaid in cash a note payable to our Chief Executive Officer totaling $0.8 million on March 31, 2014.
Effects of Inflation
The impact of inflation was not significant to our financial condition or results of operations for 2014, 2013 or 2012.
Contractual Obligations
The following table outlines payments due under our significant contractual obligations (in thousands):
| Contractual Obligations At December 31, 2014 | 2015 | 2016 | 2017 | 2018 | 2019 | Thereafter | Total | |||||||||||||||||||||
| Sourcing commitments(1) | $ | 12,784 | $ | – | $ | – | $ | – | $ | – | $ | – | $ | 12,784 | ||||||||||||||
| Debt principal | – | 34,533 | – | – | – | – | 34,533 | |||||||||||||||||||||
| Debt interest(2) | 2,603 | 1,477 | – | – | – | – | 4,080 | |||||||||||||||||||||
| Capital projects | 21,454 | 1,000 | – | – | – | – | 22,454 | |||||||||||||||||||||
| Operating leases(3) | 1,145 | 1,107 | 956 | 878 | 580 | 2,243 | 6,909 | |||||||||||||||||||||
| Capital leases(3) | 4,569 | 900 | 900 | 568 | – | – | 6,937 | |||||||||||||||||||||
| Preferred dividends(4) | 1,265 | 1,265 | 1,265 | 1,265 | 1,265 | 1,265 | 7,590 | |||||||||||||||||||||
| Total commitments | $ | 43,820 | $ | 40,282 | $ | 3,121 | $ | 2,711 | $ | 1,845 | $ | 3,508 | $ | 95,287 | ||||||||||||||
_______________
| (1) | Unconditional purchase commitments for production materials incurred in the normal course of business. |
| (2) | Payments based on interest rates and balances as of December 31, 2014 through maturity. |
| (3) | Future minimum payments under capital and non-cancelable operating leases. |
| (4) | Represents dividends on 926,942 shares of Series B Preferred Stock. |
The above table outlines our obligations as of December 31, 2014 and does not reflect the changes in our obligations that occurred after that date.
| 48 |
Critical Accounting Policies
Our discussion and analysis of our financial condition and results of operations is based upon our consolidated financial statements, which have been prepared in accordance with accounting principles generally accepted in the United States of America. The preparation of these financial statements requires us to make estimates and judgments that affect the reported amounts of assets and liabilities and disclosure of contingent assets and liabilities at the date of the financial statements and the reported amount of net sales and expenses for each period. The following represents a summary of our critical accounting policies, defined as those policies that we believe are the most important to the portrayal of our financial condition and results of operations and that require management’s most difficult, subjective or complex judgments, often as a result of the need to make estimates about the effects of matters that are inherently uncertain.
Revenue Recognition
We recognize revenue when it is realized or realizable and earned. We consider revenue realized or realizable and earned when there is persuasive evidence of an arrangement, delivery has occurred, the sales price is fixed or determinable, and collection is reasonably assured. We derive revenue primarily from sales of ethanol and related co-products. We recognize revenue when title transfers to our customers, which is generally upon the delivery of these products to a customer’s designated location. These deliveries are made in accordance with sales commitments and related sales orders entered into with customers either verbally or in written form. The sales commitments and related sales orders provide quantities, pricing and conditions of sales. In this regard, we engage in three basic types of revenue generating transactions:
| · | As a producer. Sales as a producer consist of sales of our inventory produced at the Pacific Ethanol Plants. |
| · | As a merchant. Sales as a merchant consist of sales to customers through purchases from third-party suppliers in which we may or may not obtain physical control of the ethanol or co-products in which shipments are directed from our suppliers to our terminals or direct to our customers but for which we accept the risk of loss in the transactions. |
| · | As an agent. Sales as an agent consist of sales to customers through purchases from third-party suppliers in which the risks and rewards of inventory ownership remain with third-party suppliers and we receive a predetermined service fee under these transactions. |
| 49 |
The following table shows our net sales generated as a producer, a merchant and as an agent for the years presented (in thousands):
| For the Years Ended December 31, | ||||||||||||||
| 2014 | 2013 | 2012 | ||||||||||||
| Producer | $ | 562,281 | $ | 507,159 | $ | 456,516 | ||||||||
| Merchant | 543,222 | 399,350 | 356,773 | |||||||||||
| Agent | 1,909 | 1,928 | 2,755 | |||||||||||
| $ | 1,107,412 | $ | 908,437 | $ | 816,044 | |||||||||
Revenue from sales of third-party ethanol and its co-products is recorded net of costs when we are acting as an agent between a customer and a supplier and gross when we are a principal to the transaction. Several factors are considered to determine whether we are acting as an agent or principal, most notably whether we are the primary obligor to the customer, whether we have inventory risk and related risk of loss or whether we add meaningful value to the supplier’s product or service. Consideration is also given to whether we have latitude in establishing the sales price or have credit risk, or both. When we act as an agent, we record revenues on a net basis, or our predetermined fees and any associated freight, based upon the amount of net revenues retained in excess of amounts paid to suppliers.
We record revenues based upon the gross amounts billed to our customers in transactions where we act as a producer or a merchant and obtain title to ethanol and its co-products and therefore own the product and any related unmitigated inventory risk for the ethanol, regardless of whether we actually obtain physical control of the product.
Warrants and Conversion Features Carried at Fair Value
We have recorded our warrants issued since 2010 and the conversion features of our subordinated convertible notes issued in 2013 at fair value. We believe the valuation of these warrants and conversion features is a critical accounting estimate because valuation estimates obtained from third parties involve inputs other than quoted prices to value the warrants and conversion features. Changes in these estimates, and in particular, certain of the inputs to the valuation estimates, can be volatile from period to period and may markedly impact the total mark-to-market valuation of the warrants and convertible notes recorded as fair value adjustments in our consolidated statements of operations. We recorded fair value adjustments and warrant inducements expense of $37.5 million and $1.0 million and income of $2.0 million for the years ended December 31, 2014, 2013 and 2012, respectively. Our senior convertible notes issued in 2013 have been fully retired.
Impairment of Long-Lived and Intangible Assets
Our long-lived assets have been primarily associated with the Pacific Ethanol Plants, reflecting their original book value, adjusted for any subsequent impairment.
We assess the impairment of long-lived assets, including property and equipment and purchased intangibles subject to amortization, when events or changes in circumstances indicate that the fair value of an asset could be less than the net book value of the asset. We assess long-lived assets for impairment by first determining the forecasted, undiscounted cash flows each asset is expected to generate plus the net proceeds expected from the sale of the asset. If the amount of proceeds is less than the carrying value of the asset, we then determine the fair value of the asset. An impairment loss would be recognized when the fair value is less than the related net book value, and an impairment expense would be recorded in the amount of the difference. Forecasts of future cash flows are judgments based on our experience and knowledge of our operations and the industry in which we operate. These forecasts could be significantly affected by future changes in market conditions, the economic environment, including inflation, and the purchasing decisions of our customers.
We review our intangible assets with indefinite lives at least annually or more frequently if impairment indicators arise. In our review, we determine the fair value of these assets using market multiples and discounted cash flow modeling and compare it to the net book value of the acquired assets.
We did not recognize any asset impairment charges associated with the Pacific Ethanol Plants in 2014, 2013 or 2012.
| 50 |
Allowance for Doubtful Accounts
We sell ethanol primarily to gasoline refining and distribution companies, sell WDG to dairy operators and animal feed distributors and sell corn oil to poultry and biodiesel customers. We had significant concentrations of credit risk from sales of our ethanol as of December 31, 2014 and 2013, as described in Note 1 to our consolidated financial statements included elsewhere in this report. However, historically, those ethanol customers have had good credit ratings and we have collected the amounts billed to those customers. Receivables from customers are generally unsecured. We continuously monitor our customer account balances and actively pursue collections on past due balances.
We maintain an allowance for doubtful accounts for balances that appear to have specific collection issues. Our collection process is based on the age of the invoice and requires attempted contacts with the customer at specified intervals. If after a specified number of days, we have been unsuccessful in our collection efforts, we consider recording a bad debt allowance for the balance in question. We would eventually write-off accounts included in our allowance when we have determined that collection is not likely. The factors considered in reaching this determination are the apparent financial condition of the customer, and our success in contacting and negotiating with the customer.
We recognized a bad debt recovery of less than $0.1 million, bad debt expense of $0.2 million and a bad debt recovery of less than $0.1 million for the years ended December 31, 2014, 2013 and 2012, respectively.
Impact of New Accounting Pronouncements
Not applicable.
| Item 7A. | Quantitative and Qualitative Disclosures About Market Risk. |
We are exposed to various market risks, including changes in commodity prices and interest rates as discussed below. Market risk is the potential loss arising from adverse changes in market rates and prices. In the ordinary course of business, we may enter into various types of transactions involving financial instruments to manage and reduce the impact of changes in commodity prices and interest rates. We do not expect to have any exposure to foreign currency risk as we conduct all of our contracts in the U.S. dollar.
Commodity Risk
We produce ethanol and its co-products, wet distillers grain and corn oil and therefore, our business is sensitive to changes in the prices of each of ethanol and corn. In the ordinary course of business, we may enter into various types of transactions involving financial instruments to manage and reduce the impact of changes in ethanol and corn prices. We do not enter into derivatives or other financial instruments for trading or speculative purposes.
| 51 |
We are subject to market risk with respect to ethanol pricing. Ethanol prices are sensitive to global and domestic ethanol supply, crude-oil supply and demand; crude-oil refining capacity, carbon intensity; government regulation; and consumer demand for alternative fuels. Our ethanol sales are priced using contracts that are either based upon a fixed price or an indexed price to a specific market, such as CBOT or the Oil Price Information Service. Under these fixed-priced arrangements, we are exposed to risk of a decrease in the market price of ethanol between the time this price is fixed and the time the ethanol is sold at a lower price.
We acquire our physical corn, the principal raw material used to produce ethanol and ethanol by-products, needs based on supply guaranteed contracts with our vendors. Generally, we determine the purchase price of our corn at the time we begin to grind that day’s needs. Sometimes, we may also enter into contracts with our vendors to fix a portion of the purchase price of our corn needs. As such, we are also subject to market risk with respect to the price of corn. The price of corn is subject to wide fluctuations due to unpredictable factors such as weather conditions, farmer planting decisions, governmental policies with respect to agriculture and international trade and global demand and supply. Under the fixed price arrangements, we assumes the risk of a decrease in the market price of corn between the time this price is fixed and the time the corn is consumed.
WDG and corn oil are sensitive to various demand factors such as numbers of livestock on feed, prices for feed alternatives and supply factors, primarily production by ethanol plants and other sources.
As noted above, we may attempt to reduce the market risk associated with fluctuations in the price of ethanol or corn by employing a variety of risk management and hedging strategies. Strategies include the use of derivative financial instruments such as futures and options executed on the CBOT and/or the New York Merchantile Exchange, as well as the daily management of physical corn.
These derivatives are not designated for special hedge accounting treatment, and as such, the changes in fair value of these contracts are recorded on the balance sheet and recognized immediately in cost of goods sold. We recognized losses of $1.1 million and $1.9 million, and gains of $0.7 million related to settled non-designated hedges as the change in the fair value of these contracts for the years ended December 31, 2014, 2013 and 2012, respectively.
At December 31, 2014, we prepared a sensitivity analysis to estimate our exposure to ethanol and corn. Market risk related to these factors was estimated as the potential change in pre-tax income resulting from a hypothetical 10% adverse changes in prices of our expected ethanol and corn volume for a one-year period. The results of this analysis as of December 2014, which may differ from actual results, are as follows (in millions):
| Commodity | 2014 Volume | Unit of Measure | Approximate Adverse Change to Income |
|||||
| Ethanol | 399.0 | Gallons | $ | 46.2 | ||||
| Corn | 60.8 | Bushels | $ | 33.2 | ||||
Interest Rate Risk
We are exposed to market risk from changes in interest rates. Exposure to interest rate risk results primarily from holding loans that bear variable interest rates. At December 31, 2014, all of our long-term debt of $34.5 million was variable-rate in nature. Based on a 100 basis point (1.00%) change in the interest rate on our long-term debt, our annual income would be negatively impacted by approximately $0.3 million.
| 52 |
| Item 8. | Financial Statements and Supplementary Data.. |
Reference is made to the financial statements, which begin at page F-1 of this report.
| Item 9. | Changes in and Disagreements With Accountants on Accounting and Financial Disclosure. |
None.
| Item 9A. | Controls and Procedures. |
We conducted an evaluation under the supervision and with the participation of our management, including our Chief Executive Officer and Chief Financial Officer, of the effectiveness of the design and operation of our disclosure controls and procedures. The term “disclosure controls and procedures,” as defined in Rules 13a-15(e) and 15d-15(e) under the Securities and Exchange Act of 1934, as amended, or Exchange Act, means controls and other procedures of a company that are designed to ensure that information required to be disclosed by the company in the reports it files or submits under the Exchange Act is recorded, processed, summarized and reported, within the time periods specified in the Securities and Exchange Commission’s rules and forms. Disclosure controls and procedures also include, without limitation, controls and procedures designed to ensure that information required to be disclosed by a company in the reports that it files or submits under the Exchange Act is accumulated and communicated to the company’s management, including its principal executive and principal financial officers, or persons performing similar functions, as appropriate, to allow timely decisions regarding required disclosure. Based on this evaluation, our Chief Executive Officer and Chief Financial Officer concluded as of December 31, 2014 that our disclosure controls and procedures were effective at a reasonable assurance level.
Management’s Report on Internal Control over Financial Reporting
Our management is responsible for establishing and maintaining adequate internal control over financial reporting as defined in Rules 13a-15(f) and 15d-15(f) under the Exchange Act. Our internal control over financial reporting is designed to provide reasonable assurance regarding the reliability of financial reporting and the preparation of financial statements for external purposes in accordance with generally accepted accounting principles. Our internal control over financial reporting includes those policies and procedures that:
| (i) | pertain to the maintenance of records that, in reasonable detail, accurately and fairly reflect the transactions and dispositions of our assets; |
| (ii) | provide reasonable assurance that transactions are recorded as necessary to permit preparation of financial statements in accordance with generally accepted accounting principles, and that our receipts and expenditures are being made only in accordance with authorizations of our management and directors; and |
| (iii) | provide reasonable assurance regarding prevention or timely detection of unauthorized acquisition, use or disposition of our assets that could have a material effect on our financial statements. |
Because of its inherent limitations, internal control over financial reporting may not prevent or detect misstatements. Also, projections of any evaluation of effectiveness to future periods are subject to the risk that controls may become inadequate because of changes in conditions, or that the degree of compliance with the policies or procedures may deteriorate.
| 53 |
A material weakness is defined by the Public Company Accounting Oversight Board’s Audit Standard No. 5 as being a deficiency, or combination of deficiencies, in internal control over financial reporting, such that there is a reasonable possibility that a material misstatement of the company’s annual or interim financial statements will not be prevented or detected on a timely basis by the company’s internal controls.
Under the supervision and with the participation of our management, including our principal executive officer and principal financial officer, we conducted an evaluation of the effectiveness of our internal control over financial reporting based on the framework set forth in Internal Control — Integrated Framework (2013) issued by the Committee of Sponsoring Organizations of the Treadway Commission. Based on our evaluation under the framework set forth in Internal Control — Integrated Framework (2013), our management concluded that our internal control over financial reporting was effective as of December 31, 2014. Hein & Associates LLP, an independent registered public accounting firm, has issued an attestation report on our internal control over financial reporting as of December 31, 2014. That report is included in Part IV of this report.
Inherent Limitations on the Effectiveness of Controls
Management does not expect that our disclosure controls and procedures or our internal control over financial reporting will prevent or detect all errors and all fraud. A control system, no matter how well conceived and operated, can provide only reasonable, not absolute, assurance that the objectives of the control systems are met. Further, the design of a control system must reflect the fact that there are resource constraints, and the benefits of controls must be considered relative to their costs. Because of the inherent limitations in a cost-effective control system, no evaluation of internal control over financial reporting can provide absolute assurance that misstatements due to error or fraud will not occur or that all control issues and instances of fraud, if any, have been or will be detected.
These inherent limitations include the realities that judgments in decision-making can be faulty and that breakdowns can occur because of a simple error or mistake. Controls can also be circumvented by the individual acts of some persons, by collusion of two or more people, or by management override of the controls. The design of any system of controls is based in part on certain assumptions about the likelihood of future events, and there can be no assurance that any design will succeed in achieving its stated goals under all potential future conditions. Projections of any evaluation of controls effectiveness to future periods are subject to risks. Over time, controls may become inadequate because of changes in conditions or deterioration in the degree of compliance with policies or procedures.
Changes in Internal Control over Financial Reporting
There has been no change in our internal control over financial reporting (as defined in Rules 13a-15(f) and 15d-15(f) under the Exchange Act) during the most recently completed fiscal quarter that has materially affected, or is reasonably likely to materially affect, our internal control over financial reporting.
| Item 9B. | Other Information. |
None.
| 54 |
PART III
| Item 10. | Directors, Executive Officers and Corporate Governance. |
Directors
The following table sets forth certain information regarding our directors as of March 13, 2015:
Name |
Age |
Position(s) Held | ||
| William L. Jones(1) | 65 | Chairman of the Board and Director | ||
| Neil M. Koehler | 57 | Chief Executive Officer, President and Director | ||
| Michael D. Kandris | 67 | Chief Operating Officer and Director | ||
| Terry L. Stone(2) | 65 | Director | ||
| John L. Prince(3) | 72 | Director | ||
| Douglas L. Kieta(3) | 72 | Director | ||
| Larry D. Layne(4) | 74 | Director |
_______________
| (1) | Member of the Audit Committee. |
| (2) | Member of the Audit and Compensation Committees. |
| (3) | Member of the Compensation and Nominating and Corporate Governance Committees. |
| (4) | Member of the Audit, Compensation and Nominating and Corporate Governance Committees. |
Experience and Background
The biographies below describe the skills, qualities and attributes and business experience of each of our directors, including the capacities in which they served during the past five years:
William L. Jones has served as Chairman of the Board of Directors, or Board, and as a director since March 2005. Mr. Jones is a co-founder of Pacific Ethanol California, Inc., or PEI California, which is one of our predecessors, and served as Chairman of the Board of PEI California since its formation in January 2003 through March 2004, when he stepped off the board of directors of PEI California to focus on his candidacy for one of California’s United States Senate seats. Mr. Jones was California’s Secretary of State from 1995 to 2003. Since May 2002, Mr. Jones has also been the owner of Tri-J Land & Cattle, a diversified farming and cattle company in Fresno County, California. Mr. Jones has a B.A. degree in Agribusiness and Plant Sciences from California State University, Fresno.
Mr. Jones’s qualifications to serve on our Board include:
| · | co-founder of PEI California; |
| · | knowledge gained through his extensive work as our Chairman since our inception in 2005; |
| · | extensive knowledge of and experience in the agricultural and feed industries, as well as a deep understanding of operations in political environments; and |
| · | background as an owner of a farming company in California, and his previous role in the California state government. |
Neil M. Koehler has served as Chief Executive Officer, President and as a director since March 2005. Mr. Koehler is a co-founder of PEI California and served as its Chief Executive Officer since its formation in January 2003 and as a member of its board of directors from March 2004 until its dissolution in March 2012. Prior to his association with PEI California, Mr. Koehler was the co-founder and General Manager of Parallel Products, one of the first ethanol production facilities in California, which was sold to a public company in 1997. Mr. Koehler was also the sole manager and sole limited liability company member of Kinergy Marketing, LLC, which he founded in September 2000, and which is one of our wholly-owned subsidiaries. Mr. Koehler has over 30 years of experience in the ethanol production, sales and marketing industry in the Western United States. Mr. Koehler is a Director of the RFA and is a nationally-recognized speaker on the production and marketing of renewable fuels. Mr. Koehler has a B.A. degree in Government from Pomona College.
| 55 |
Mr. Koehler’s qualifications to serve on our Board include:
| · | day-to-day leadership experience as our current President and Chief Executive Officer provides Mr. Koehler with intimate knowledge of our operations; |
| · | extensive knowledge of and experience in the ethanol production, sales and marketing industry, particularly in the Western United States; |
| · | prior leadership experience with other companies in the ethanol industry; and |
| · | day-to-day leadership experience affords a deep understanding of business operations, challenges and opportunities. |
Michael D. Kandris has served as a director since June 2008 and as our Chief Operating Officer since January 6, 2013. Mr. Kandris served as an independent contractor with supervisory responsibility for ethanol plant operations, under the direction of our Chief Executive Officer, from January 1, 2012 to January 5, 2013. Mr. Kandris was President, Western Division of Ruan Transportation Management Systems from November 2007 until his retirement in September 2009. From January 2000 to November 2007, Mr. Kandris served as President and Chief Operating Officer of Ruan Transportation Management Systems, where he had overall responsibility for all operations, finance and administrative functions. Mr. Kandris has 30 years of experience in all modes of transportation and logistics. Mr. Kandris served on the Executive Committee of the American Trucking Association and as a board member for the National Tank Truck Organization until his retirement from Ruan Transportation Management Systems in September 2009. Mr. Kandris has a B.S. degree in Business from California State University, Hayward.
Mr. Kandris’ qualifications to serve on our Board include:
| · | extensive experience in various executive leadership positions; |
| · | extensive experience in rail and truck transportation and logistics; and |
| · | day-to-day leadership experience affords a deep understanding of business operations, challenges and opportunities. |
Terry L. Stone has served as a director since March 2005. Mr. Stone is a Certified Public Accountant with over thirty years of experience in accounting and taxation. He has been the owner of his own accountancy firm since 1990 and has provided accounting and taxation services to a wide range of industries, including agriculture, manufacturing, retail, equipment leasing, professionals and not-for-profit organizations. Mr. Stone has served as a part-time instructor at California State University, Fresno, teaching classes in taxation, auditing and financial and management accounting. Mr. Stone is also a financial advisor and franchisee of Ameriprise Financial Services, Inc. Mr. Stone has a B.S. degree in Accounting from California State University, Fresno.
Mr. Stone’s qualifications to serve on our Board include:
| · | extensive experience with financial accounting and tax matters; |
| · | recognized expertise as an instructor of taxation, auditing and financial and management accounting; |
| · | “audit committee financial expert,” as defined by the Securities and Exchange Commission, and satisfies the “financial sophistication” requirements of NASDAQ’s listing standards; and |
| · | ability to communicate and encourage discussion, together with his experience as a senior independent director of all Board committees on which he serves make him an effective chairman of our Audit Committee. |
| 56 |
John L. Prince has served as a director since July 2005. Mr. Prince is retired but also works as a consultant. Mr. Prince was an Executive Vice President with Land O’ Lakes, Inc. from July 1998 until his retirement in 2004. Prior to that time, Mr. Prince was President and Chief Executive Officer of Dairyman’s Cooperative Creamery Association located in Tulare, California, until its merger with Land O’ Lakes, Inc. in July 1998. Land O’ Lakes, Inc. is a farmer-owned, national branded organization based in Minnesota with annual sales in excess of $6 billion and membership and operations in over 30 states. Prior to joining the Dairyman’s Cooperative Creamery Association, Mr. Prince was President and Chief Executive Officer for nine years until 1994, and was Operations Manager for the preceding ten years commencing in 1975, of the Alto Dairy Cooperative in Waupun, Wisconsin. Mr. Prince has a B.A. degree in Business Administration from the University of Northern Iowa.
Mr. Prince’s qualifications to serve on our Board include:
| · | extensive experience in various executive leadership positions; |
| · | day-to-day leadership experience affords a deep understanding of business operations, challenges and opportunities; and |
| · | ability to communicate and encourage discussion helps Mr. Prince discharge his duties effectively as chairman of our Nominating and Corporate Governance Committee. |
Douglas L. Kieta has served as a director since April 2006. Mr. Kieta is currently retired but also works as a consultant through Century West Projects, Inc., of which he is the President and an owner, providing project and construction management services. Prior to retirement in January 2009, Mr. Kieta was employed by BE&K, Inc., a large engineering and construction company headquartered in Birmingham, Alabama, where he served as the Vice President of Power from May 2006 to January 2009. From April 1999 to April 2006, Mr. Kieta was employed at Calpine Corporation where he was the Senior Vice President of Construction and Engineering. Calpine Corporation is a major North American power company which leases and operates integrated systems of fuel-efficient natural gas-fired and renewable geothermal power plants and delivers clean, reliable and fuel-efficient electricity to customers and communities in 21 states and three Canadian provinces. Mr. Kieta has a B.S. degree in Civil Engineering from Clarkson University and a Master’s degree in Civil Engineering from Cornell University.
Mr. Kieta’s qualifications to serve on our Board include:
| · | extensive experience in various leadership positions; |
| · | day-to-day leadership experience affords a deep understanding of business operations, challenges and opportunities; and |
| · | service with Calpine affords a deep understanding of large-scale construction and engineering projects as well as plant operations, which is particularly relevant to our ethanol production facility operations. |
| 57 |
Larry D. Layne has served as a director since December 2007. Mr. Layne joined First Western Bank in 1963 and served in various capacities with First Western Bank and its acquiror, Lloyds Bank of California, and Lloyd’s acquiror, Sanwa Bank California, until his retirement in 2000. Sanwa Bank California was subsequently acquired by Bank of the West. From 1999 to 2000, Mr. Layne was Vice Chairman of Sanwa Bank California in charge of its Commercial Banking Group which encompassed all of Sanwa Bank California’s 38 commercial and business banking centers and 12 Pacific Rim branches as well as numerous internal departments. From 1997 to 2000, Mr. Layne was also Chairman of the Board of The Eureka Funds, a mutual fund family of five separate investment funds with total assets of $900,000,000. From 1996 to 2000, Mr. Layne was Group Executive Vice President of the Relationship Banking Group of Sanwa Bank California in charge of its 107 branches and 13 commercial banking centers as well as numerous internal departments. Mr. Layne has also served in various capacities with many industry and community organizations, including as Director and Chairman of the Board of the Agricultural Foundation at California State University, Fresno; Chairman of the Audit Committee of the Ag. Foundation at California State University, Fresno; board member of the Fresno Metropolitan Flood Control District; and Chairman of the Ag Lending Committee of the California Bankers Association. Mr. Layne has a B.S. degree in Dairy Husbandry from California State University, Fresno and is a graduate of the California Agriculture Leadership Program.
Mr. Layne’s qualifications to serve on our Board include:
| · | extensive experience in various leadership positions; |
| · | day-to-day leadership experience affords a deep understanding of business operations, challenges and opportunities; |
| · | experience and involvement in California industry and community organizations provides a useful perspective; and |
| · | ability to communicate and encourage discussion helps Mr. Layne discharge his duties effectively as chairman of our Compensation Committee. |
Corporate Governance
Our Board believes that good corporate governance is paramount to ensure that Pacific Ethanol is managed for the long-term benefit of our stockholders. Our Board has adopted corporate governance guidelines that guide its actions with respect to, among other things, the composition of the Board and its decision making processes, Board meetings and involvement of management, the Board’s standing committees and procedures for appointing members of the committees, and its performance evaluation of our Chief Executive Officer.
Our Board has adopted a Code of Ethics that applies to all of our directors, officers and employees and an additional Code of Ethics that applies to our Chief Executive Officer and senior financial officers. The Codes of Ethics, as applied to our principal executive officer, principal financial officer and principal accounting officer constitutes our “code of ethics” within the meaning of Section 406 of the Sarbanes-Oxley Act of 2002 and is our “code of conduct” within the meaning of NASDAQ’s listing standards. Our Codes of Ethics are available at our website at http://www.pacificethanol.com/investors/governance. Information on our Internet website is not, and shall not be deemed to be, a part of this report or incorporated into any other filings we make with the Securities and Exchange Commission.
Board Committees
Our Board has established standing Audit, Compensation and Nominating and Corporate Governance Committees. Each committee operates pursuant to a written charter that has been approved by our Board and the corresponding committee and that is reviewed annually and revised as appropriate. Each charter is available at our website at http://www.pacificethanol.com/investors/governance. Information on our Internet website is not, and shall not be deemed to be, a part of this report or incorporated into any other filings we make with the Securities and Exchange Commission.
| 58 |
Our Audit Committee selects our independent auditors, reviews the results and scope of the audit and other services provided by our independent auditors, reviews our financial statements for each interim period and for the full year and implements and manages our enterprise risk management program. The Audit Committee also has the authority to retain consultants, and other advisors. Messrs. Stone, Layne and Jones served on our Audit Committee for all of 2014. Our Board has determined that each member of the Audit Committee is “independent” under the current NASDAQ listing standards and satisfies the other requirements under NASDAQ listing standards and Securities and Exchange Commission rules regarding audit committee membership. Our Board has determined that Mr. Stone qualifies as an “audit committee financial expert” under applicable Securities and Exchange Commission rules and regulations governing the composition of the Audit Committee, and satisfies the “financial sophistication” requirements of NASDAQ’s listing standards.
Executive Officers
The following table sets forth certain information regarding our executive officers as of March 13, 2015:
Name |
Age |
Position(s) Held | ||
| Neil M. Koehler | 57 | Chief Executive Officer, President and Director | ||
| Michael D. Kandris | 67 | Chief Operating Officer and Director | ||
| Bryon T. McGregor | 51 | Chief Financial Officer | ||
| Christopher W. Wright | 62 | Vice President, General Counsel and Secretary | ||
| Paul P. Koehler | 55 | Vice President of Corporate Development | ||
| James R. Sneed | 48 | Vice President of Ethanol Supply and Trading |
Neil M. Koehler has served as Chief Executive Officer, President and as a director since March 2005. Mr. Koehler is a co-founder of PEI California and served as its Chief Executive Officer since its formation in January 2003 and as a member of its board of directors from March 2004 until its dissolution in March 2012. Prior to his association with PEI California, Mr. Koehler was the co-founder and General Manager of Parallel Products, one of the first ethanol production facilities in California, which was sold to a public company in 1997. Mr. Koehler was also the sole manager and sole limited liability company member of Kinergy Marketing, LLC, which he founded in September 2000, and which is one of our wholly-owned subsidiaries. Mr. Koehler has over 30 years of experience in the ethanol production, sales and marketing industry in the Western United States. Mr. Koehler is a Director of the RFA and is a nationally-recognized speaker on the production and marketing of renewable fuels. Mr. Koehler has a B.A. degree in Government from Pomona College.
Michael D. Kandris has served as a director since June 2008 and as our Chief Operating Officer since January 6, 2013. Mr. Kandris served as an independent contractor with supervisory responsibility for ethanol plant operations, under the direction of our Chief Executive Officer, from January 1, 2012 to January 5, 2013. Mr. Kandris was President, Western Division of Ruan Transportation Management Systems from November 2007 until his retirement in September 2009. From January 2000 to November 2007, Mr. Kandris served as President and Chief Operating Officer of Ruan Transportation Management Systems, where he had overall responsibility for all operations, finance and administrative functions. Mr. Kandris has 30 years of experience in all modes of transportation and logistics. Mr. Kandris served on the Executive Committee of the American Trucking Association and as a board member for the National Tank Truck Organization until his retirement from Ruan Transportation Management Systems in September 2009. Mr. Kandris has a B.S. degree in Business from California State University, Hayward.
| 59 |
Bryon T. McGregor has served as our Chief Financial Officer since November 19, 2009. Mr. McGregor served as Vice President, Finance at Pacific Ethanol from September 2008 until he became Interim Chief Financial Officer in April 2009. Prior to joining Pacific Ethanol, Mr. McGregor was employed as Senior Director for E*TRADE Financial from February 2002 to August 2008, serving in various capacities including International Treasurer based in London, England from 2006 to 2008, Brokerage Treasurer and Director from 2003 to 2006 and Assistant Treasurer and Director of Finance and Investor Relations from 2002 to 2003. Prior to joining E*TRADE, Mr. McGregor served as Manager of Finance and Head of Project Finance for BP (formerly Atlantic Richfield Company – ARCO) from 1998 to 2001. Mr. McGregor has extensive experience in banking and served as a Director of International Project Finance for Credit Suisse from 1992 to 1998, as Assistant Vice President for Sumitomo Mitsubishi Banking Corp (formerly The Sumitomo Bank Limited) from 1989 to 1992, and as Commercial Banking Officer for Bank of America from 1987 to 1989. Mr. McGregor has a B.S. degree in Business Management from Brigham Young University.
Christopher W. Wright has served as Vice President, General Counsel and Secretary since June 2006. From April 2004 until he joined Pacific Ethanol in June 2006, Mr. Wright operated an independent consulting practice, advising companies on complex transactions, including acquisitions and financings. Prior to that time, from January 2003 to April 2004, Mr. Wright was a partner with Orrick, Herrington & Sutcliffe, LLP, and from July 1998 to December 2002, Mr. Wright was a partner with Cooley Godward LLP, where he served as Partner-in-Charge of the Pacific Northwest office. Mr. Wright has extensive experience advising boards of directors on compliance, securities matters and strategic transactions, with a particular focus on guiding the development of rapidly growing companies. He has acted as general counsel for numerous technology enterprises in all aspects of corporate development, including fund-raising, business and technology acquisitions, mergers and strategic alliances. Mr. Wright has an A.B. degree in History from Yale College and a J.D. from the University of Chicago Law School.
Paul P. Koehler has served as Vice President of Corporate Development since 2005. Mr. Koehler has over 25 years of experience in business development and marketing in the energy industry. Prior to joining Pacific Ethanol in 2005, he served as Director of Business Development for PPM Energy, Inc., leading PPM’s efforts to develop and acquire several wind power projects. Mr. Koehler was also a co-founder of ReEnergy, one of the companies acquired by Pacific Ethanol. Mr. Koehler has also served as a member of the board of directors of Towerstream Corporation, a public company, since May 30, 2007. During the 1990s he worked for Portland General Electric and Enron in marketing and origination of long-term transactions, risk management, and energy trading. Mr. Koehler has a B.A. degree from the Honors College at the University of Oregon.
James R. Sneed has served as Vice President of Ethanol Supply and Trading since September 2012. Mr. Sneed has worked for over 20 years in various senior management and executive positions in the ethanol industry. Prior to joining Pacific Ethanol in 2012, Mr. Sneed was employed by Hawkeye Gold, LLC from April 2010 to September 2012, ultimately serving as Vice President – Ethanol Marketing and Trading. Prior to that time, from May 2003 to April 2010, Mr. Sneed was employed by Aventine Renewable Energy, an ethanol production and marketing company, where he helped build its operations from two ethanol plants in two states to marketing for fifteen production facilities in eight states, ultimately serving as Vice President, Marketing and Logistics. Mr. Sneed is a Certified Public Accountant, has a B.S. degree in Accounting from Olivet Nazarene University, and has an MBA degree from Northwestern University, Kellogg School of Management.
Our officers are appointed by and serve at the discretion of our Board. Except for Neil M. Koehler and Paul P. Koehler, who are brothers, there are no family relationships among our executive officers and directors.
| 60 |
Section 16(a) Beneficial Ownership Reporting Compliance
Section 16(a) of the Exchange Act requires our executive officers and directors, and persons who beneficially own more than 10% of a registered class of our common stock, to file initial reports of ownership and reports of changes in ownership with the Securities and Exchange Commission. These officers, directors and stockholders are required by Securities and Exchange Commission regulations to furnish us with copies of all reports that they file.
Based solely upon a review of copies of the reports furnished to us during the year ended December 31, 2014 and thereafter, or any written representations received by us from directors, officers and beneficial owners of more than 10% of our common stock (“reporting persons”) that no other reports were required, we believe that all reporting persons filed on a timely basis all reports required by Section 16(a) of the Exchange Act during the year ended December 31, 2014 or prior fiscal years.
| Item 11. | Executive Compensation. |
Compensation Discussion and Analysis
In this section, we explain the material elements of our executive compensation program for our Chief Executive Officer and our other named executive officers, or NEOs, identified below whose compensation is in the executive compensation tables beginning on page 83 below.
| · | Neil M. Koehler, Chief Executive Officer and President |
| · | Michael D. Kandris, Chief Operating Officer |
| · | Bryon T. McGregor, Chief Financial Officer |
| · | Christopher W. Wright, Vice President, General Counsel and Secretary |
| · | James R. Sneed, Vice President of Ethanol Supply and Trading |
The executive compensation tables provide additional important information regarding the compensation and benefits awarded to, earned by or paid to our NEOs over our last three fiscal years, as well as the compensation programs in which our NEOs are eligible to participate. You should read that section in conjunction with this section.
The Compensation Committee of our Board administers our executive compensation program. Each member of the Compensation Committee is “independent” under applicable NASDAQ listing standards, is an “outside director” within the meaning of Section 162(m) of the Internal Revenue Code, and is a non-employee director within the meaning of Section 16 of the Exchange Act.
Executive Summary
Our executive compensation program is intended to achieve the following objectives:
| · | attract, retain, motivate and reward key executive officers responsible for our success; |
| · | align and strengthen the mutuality of interests between our executive officers, our company and our stockholders; |
| · | deliver compensation that reflects our financial and operational performance, while providing the opportunity to earn above-targeted total compensation for exceptional performance; and |
| · | provide total compensation to each executive officer that is internally equitable, competitive, and influenced by company and individual performance. |
| 61 |
We believe that our success depends in large part on our ability to attract, retain and motivate qualified executives through competitive compensation arrangements. We also believe that the compensation paid to our executive officers should be influenced by the value we create for our stockholders. For these reasons, our Compensation Committee believes that our compensation programs should provide incentives to attain both short- and long-term financial and other business objectives and reward those executive officers who contribute meaningfully to attaining those objectives. The Compensation Committee supports a pay-for-performance philosophy within a compensation structure that is competitive, internally equitable and responsible.
Our executive compensation program consists of three primary elements:
| · | base salary; |
| · | annual performance-based cash incentive compensation; and |
| · | long-term equity incentive compensation. |
2014 Pay-for-Performance Highlights
We revised our compensation programs for 2014. We achieved this through extensive internal analysis and by engaging a third party compensation consultant. Due to the extensive work involved in this analysis of our compensation programs, our compensation decisions for 2014 described in this Executive Compensation section were generally finalized later in the year in June 2014.
In 2014, we achieved both strong financial performance and significant progress towards our strategic objectives. Highlights of 2014 include:
| · | Strong Net Income. We reported strong net income of $20.0 million, or $0.88 per diluted share. |
| · | Record Adjusted EBITDA. We achieved a record $95.0 million of earnings before interest, taxes, debt extinguishments, fair value adjustments and warrant inducements and depreciation and amortization, or Adjusted EBITDA. Adjusted EBITDA is the financial performance measure under Pacific Ethanol’s annual cash incentive compensation plan. |
| · | Kinergy’s Adjusted Net Income. Kinergy achieved $4.1 million of adjusted net income, or Adjusted Net Income, calculated by reducing Kinergy’s net income by taxes deemed incurred (excluding the effect of tax loss carryforwards) and adjusting Kinergy’s net income, either up or down, for any policy or change in practice imposed during the year which affected Kinergy’s net income that was not accounted for in Kinergy’s budgeted net income. Kinergy’s Adjusted Net Income, together with our overall Adjusted EBITDA, are the financial performance measures under Kinergy’s annual cash inventive compensation plan. |
| · | Record Cash Flows from Operations. We generated $88.3 million of cash flow from operations, allowing us to make substantial repayments of our outstanding consolidated indebtedness and reinvest in the Pacific Ethanol Plants through a number of plant improvement initiatives. |
| · | Restart of Madera, California Plant. We restarted ethanol production at our Madera, California plant in April 2014 and achieved production levels at full capacity by the end of the second quarter of 2014. |
| · | Substantial Repayment of Outstanding Indebtedness. We repaid $70.8 million in consolidated debt, including all indebtedness at the parent company level, significantly improving our balance sheet and cost of capital, and reducing our consolidated third-party debt at the Pacific Ethanol Plant level to $17.0 million. |
| 62 |
As a result of our financial performance and other accomplishments, as well as the compensation of our NEOs compared to the market data and other factors discussed under “Compensation Decisions for 2014” on page 73 below and elsewhere in this Executive Compensation section, total direct compensation increased for 2014 for Neil M. Koehler, our Chief Executive Officer, by 33.4%, for Michael D. Kandris, our Chief Operating Officer, by 23.7%, for Bryon T. McGregor, our Chief Financial Officer, by 38.5%, and for Christopher W. Wright, our Vice President, General Counsel and Secretary, by 38.5%. The increases reflect a combination of additional base salary, performance-based annual cash incentive compensation and long-term equity incentive compensation, with the bulk of the increases arising from changes to our performance-based annual cash incentive compensation program. These percentage increases exclude the value of certain stock awards made to certain NEOs in respect of their 2012 compensation that were grated in 2013. See footnotes 4, 6 and 7 to the “Summary Compensation Table” on page 83 below.
Total direct compensation for 2014 for James R. Sneed, our Vice President of Ethanol Supply and Trading, decreased by 41.7%. This decrease arises primarily from revisions to our annual cash incentive compensation plan for Kinergy with compensation levels more aligned with the compensation of similarly situated personnel at other organizations consistent with market data provided by our compensation consultants. In addition, we did not impose an overall dollar cap for Kinergy’s bonus plan for 2013, resulting in high bonus compensation paid to Mr. Sneed for that year. Our Compensation Committee revised Kinergy’s annual cash incentive compensation plan to include an overall dollar cap for 2014.
The 2014 compensation information in this report includes actual results for 2014 under our performance-based annual cash incentive compensation plans. Our annual cash incentive compensation plan payouts were made in February 2015. The payouts under the Pacific Ethanol plan reflect overall achievement of the plan’s financial performance element at 192% of the target level. This achievement reflects a level of Adjusted EBITDA that was 92% above our target level, and strong individual performance that resulted in maximum payouts under our individual performance measure. The Adjusted EBITDA we generated in 2014 was the result of substantially improved market conditions and our successful execution of a variety of strategic and other initiatives in 2014.
The payout under the Kinergy plan reflects overall achievement of the financial performance elements by James R. Sneed, our Vice President of Ethanol Supply and Trading, at 160% of the target level. This achievement reflects a level of Adjusted EBITDA that was 92% above our target level, a level of Kinergy’s Adjusted Net Income that was 40% above our target level, and strong individual performance that resulted in the maximum payout under our individual performance measure. Kinergy’s Adjusted Net Income generated in 2014 was the result of substantially improved market conditions and our efforts at efficiently managing Kinergy’s operations.
Compensation Philosophy and Objectives
Our compensation philosophy and objectives are to align the interests of our executive officers with those of our stockholders and incent our executive officers to attain our short- and long-term financial and other business goals. We also seek to ensure that our executive compensation structure and total compensation is fair, reasonable and competitive in the marketplace so that we can attract and retain superior personnel in key positions. In addition, we endeavor to provide an executive compensation structure and total compensation that are internally equitable based upon each executive officer’s role and responsibilities, while grouping executive officers within compensation tiers, to promote a collaborative working environment, when the executive officers are considered too closely aligned to make meaningful compensation distinctions. Our Compensation Committee seeks to make executive compensation decisions that embody this philosophy and that are directed towards attaining these objectives.
In implementing our compensation philosophy and objectives, our Compensation Committee reviews and analyzes each executive position, including the importance and scope of the role and how the position compares to other Pacific Ethanol executive officers and personnel. Our Compensation Committee also compares these positions to similar positions at organizations from across the United States, including organizations engaged in the chemicals, light and heavy manufacturing, and construction and materials industries, as further described below under “Benchmarking”. In addition, our Compensation Committee draws from other compensation-related market data. This information helps provide our Compensation Committee with an understanding of how total compensation for each executive officer relates to the value of his or her position and, given our particular circumstances, whether the executive officer should be grouped with others within a compensation tier.
| 63 |
We believe that structuring our executive officer compensation program to align the interests of our executive officers with our interests and those of our stockholders, and properly incenting our executive officers to attain our short- and long-term business goals, best serves the interests of our stockholders and creates stockholder value. We believe this occurs through motivating our executive officers to attain our short- and long-term business goals and retaining these executive officers by providing compensation opportunities that are competitive in the marketplace and internally equitable. We also endeavor to design our executive compensation programs so they are not reasonably likely to materially and adversely affect us, as discussed in more detail in “Compensation Risk Analysis” on page 82 below. We intend that total compensation paid or available to our executive officers, including base salary, annual cash incentive compensation, long-term equity incentive compensation and benefits, is consistent with our compensation philosophy and objectives described above.
Compensation Governance Practices
Below we highlight various executive compensation governance practices intended to align the interests of our executive officers with those of our stockholders, incent the attainment of our short- and long-term business objectives, and attract and retain superior employees in key positions.
| · | Pay-for-performance. We tie a substantial portion of pay to company and individual performance. We structure total compensation with significant annual cash incentives and a long-term equity component, thereby making a substantial portion of each NEO’s targeted total compensation dependent upon company and individual performance as well as the performance of our stock price. |
| · | Retention through long-term equity awards. We employ long-term equity awards through grants of restricted stock that vest in the future. These equity awards are designed to aid in our retention of key personnel in important positions and align the interests of our executive officers with those of our stockholders. |
| · | Long vesting periods. Our equity awards to our NEOs generally vest in annual installments over a three year period. |
| · | Linkage of annual cash incentive compensation plans to company performance. Our annual cash incentive compensation plans link a substantial portion of targeted and potential payouts to our financial performance. The 2014 financial performance measure for the compensation pool for our primary incentive compensation plan was Adjusted EBITDA, which we weighted at 80% for our NEOs covered by that plan. In addition, Kinergy’s annual cash incentive compensation plan, applicable only to James R. Sneed, our Vice President of Ethanol Supply and Trading, linked his targeted and potential payouts to Kinergy’s financial performance, in particular, Kinergy’s Adjusted Net Income as well as our overall Adjusted EBITDA, which were collectively weighted at 80% for Mr. Sneed. The 2014 non-financial performance measure for funding the compensation pools for these incentive compensation plans was individual performance measured against pre-established goals, which we weighted at 20% for our NEOs. |
| · | Compensation Tiers. We group certain executive officers together within a compensation tier to promote a collaborative working environment. Our Compensation Committee makes these determinations when the executive officers are considered too closely aligned to make meaningful compensation distinctions and to promote teamwork. |
| 64 |
| · | Perquisites. We do not currently offer our NEOs any significant perquisites, other than certain travel perquisites or those offered to our employees generally. Our executive officers are not guaranteed any retirement or pension benefits or any non-qualified deferred compensation plans. Instead, we offer our NEOs the opportunity to accumulate assets through their equity awards and the appreciation of their equity awards, and offer the opportunity to participate in our 401(k) plan on the same basis as our other employees. |
| · | Independent Compensation Consultant. Our independent compensation consultant, Hay Group, Inc., or Hay Group, is retained directly by our Compensation Committee and performs no additional services for us. |
| · | No short selling, pledging or hedging. Our insider trading policy prohibits all employees, officers and directors from engaging in any short sale of Pacific Ethanol securities, as well as any transaction involving puts, calls, collars, forward sales contracts, warrants or other options on Pacific Ethanol securities. Additionally, our executive officers are restricted from pledging Pacific Ethanol securities as collateral for a loan. |
| · | No option re-pricing. Our 2006 Plan does not permit options or stock appreciation rights to be repriced to a lower exercise price without the approval of our stockholders, except in connection with certain changes to our capital structure. |
Executive Compensation Program and Processes
Participants
Compensation Committee
Our Compensation Committee, with input from our management and one or more independent compensation consultants, establishes, refines and updates our executive compensation program. Our Compensation Committee establishes our compensation philosophy and objectives; oversees the design and administration of our executive compensation program; establishes the elements and mix of total compensation; sets the parameters and specific target metrics of our performance-based incentive compensation plan; and determines the target compensation of our executive officers.
Our Compensation Committee has the authority to retain independent counsel, advisors and other experts to assist it in the compensation-setting process and receives adequate funding to engage those service providers.
Independent Compensation Consultant
In October 2013, following a competitive request for proposal from three different compensation consultants, our Compensation Committee retained Hay Group as its independent advisor for its 2013−2014 compensation review. Hay Group was selected based on its expertise and skilled team dedicated to meet the needs of our Compensation Committee and its experience with ethanol and other companies closely tied to agriculture and commodity businesses.
Hay Group furnishes independent data, market analyses and advice to our Compensation Committee concerning executive compensation, including regarding the competitiveness of compensation plan design and evolving executive compensation trends and practices. Hay Group is available to attend and participate in Compensation Committee meetings from time to time as and when requested by our Compensation Committee. Hay Group also advises our Compensation Committee on the principal aspects of our executive compensation program, including the implementation of our compensation philosophy and objectives, and specific elements of executive compensation.
| 65 |
In evaluating Hay Group’s independence, our Compensation Committee considered multiple factors. In particular, our Compensation Committee reviewed all services Hay Group provided to Pacific Ethanol in 2013 and 2014. These services included consulting services to help us determine appropriate compensation for 2014 for our NEOs as well as certain non-NEO personnel. The fees for these consulting services were not segregated between consulting services in respect of NEO compensation and consulting services in respect of non-NEO personnel compensation. In total, fees paid to Hay Group for services rendered to help us determine appropriate compensation for 2014 were $34,000. Our Compensation Committee also considered Pacific Ethanol’s purchase of survey data from Hay Group for purposes of benchmarking NEO and non-NEO compensation, which amounted to $18,000. We did not engage Hay Group, and no fees were paid to Hay Group, in respect of any services other than Hay Group’s work with our Compensation Committee to help us determine appropriate compensation for 2014 for our NEOs and certain non-NEO personnel. In evaluating Hay Group’s independence, our Compensation Committee also considered Hay Group’s internal mechanisms and policies to ensure Hay Group’s ability to provide objective advice, including that:
| · | Hay Group is hired by the Compensation Committee and reports directly to the Compensation Committee; and |
| · | Hay Group has a broad base of clients, which reduces its reliance on any specific account for achieving its business goals. |
Hay Group also represented to the Compensation Committee that there are no personal or business relationships between the Hay Group account manager and any member of the Compensation Committee or any NEO beyond the Pacific Ethanol relationship. Further, the Hay Group account manager does not directly own any Pacific Ethanol shares (although some of the account manager’s investments controlled solely by independent, third-party managers may own Pacific Ethanol shares by way of indexed funds). Based on the above and other factors, including the factors set forth under Rule 10C-1 of the Exchange Act, the Compensation Committee assessed Hay Group’s independence and concluded that no conflict of interest exists that would prevent Hay Group from independently representing the Compensation Committee.
Management
Our Chief Executive Officer and other executive officers attend Compensation Committee meetings as requested by the Compensation Committee. These individuals are not present during executive sessions of Compensation Committee meetings except at the invitation of the Compensation Committee. Our General Counsel, under the direction of our Chief Executive Officer, leads our management in preparing recommendations on executive and employee compensation requested by the Compensation Committee.
Benchmarking
Our Compensation Committee benchmarks the total compensation of our NEOs using compensation market data as a reference to assist it in understanding the competitive pay positioning of total compensation and each element of compensation. Our Compensation Committee reviews compensation for each executive officer in relation to the middle 50% of the market (defined by the 25th, 50th and 75th percentiles of the compensation market data) that, along with other factors, provides context for executive pay decisions. Hay Group provided, for comparative purposes, compensation data from surveys of third parties that includes information from United States industrial companies, including organizations engaged in the chemicals, light and heavy manufacturing, and construction and materials industries. We have included in Exhibit 99.1 to this report the companies included in the survey data.
| 66 |
Other Factors Considered in Setting Compensation
In addition to a review of our competitive market position, our Compensation Committee also took into account several other important factors in setting executive compensation for 2014, including company performance, internal pay equity considerations, the experience and responsibilities of each NEO, budget constraints, market conditions, individual performance, and contributions to corporate achievements.
As part of the 2014 compensation-setting process for our NEOs, our Compensation Committee also reviewed “tally sheets” comprised of spreadsheets and tabular information that indicated the dollar amount of each component of compensation, including current and proposed base salaries, the proposed actual cash incentives to be paid for the prior year and the targeted cash incentives for the current year, and current projected values for the proposed equity-based awards based on stock price assumptions. The purpose of those tally sheets was to provide our Compensation Committee with a comprehensive snapshot of both the actual compensation provided to our executive officers and the potential compensation that could result from the various components of their proposed 2014 compensation packages. The Compensation Committee did not take into account the potential payments under our severance and change-in-control arrangements as the Compensation Committee sought to maintain the appropriate incentives with regard to matters that might result in severance and change-in-control payments. See “Other Policies and Factors Affecting Executive Officer Compensation—Severance and Change-in-Control Arrangements” below.
The Role of Stockholder Say-on-Pay Votes
We provide our stockholders with the opportunity to cast an advisory vote on the compensation of our NEOs each year. At our 2014 annual meeting, approximately 83% of votes cast on our “say-on-pay” proposal were voted in favor of the proposal.
Our Compensation Committee considered the outcome of this advisory vote and believes it conveyed the support of our stockholders of the Compensation Committee’s decisions and our executive compensation programs and practices for 2013. After considering this advisory vote and other factors, our Compensation Committee decided, however, to revise our executive compensation programs for 2014 to more closely align them with our compensation philosophy and objectives.
In keeping with the approval of our proposal at our 2013 annual meeting to submit “say-on-pay” advisory proposals to our stockholders annually, we will continue to do so for the foreseeable future and our Compensation Committee will continue to consider the results of future “say-on-pay” advisory votes in its ongoing evaluation of our compensation programs and practices.
Risk Considerations
As discussed in “Compensation Risk Analysis” below, the Compensation Committee reviews our compensation programs annually and for 2014 concluded that these programs did not create risks that could be reasonably likely to have a material adverse effect on us.
| 67 |
Elements of Compensation
Our executive compensation program is comprised of three principal elements designed to operate together as part of an integrated compensation package to further our compensation objectives. The three principal elements of our executive compensation program are:
| · | Cash compensation in the form of base salary; |
| · | Annual cash incentive compensation; and |
| · | Long-term equity incentive compensation. |
In addition, our executive compensation program also includes indirect compensation in the form of standard employee benefit programs, limited perquisites and other executive benefits, and severance and change-in-control benefits. Our executive compensation program also allows for special discretionary cash or equity awards to address specific individual circumstances not fully addressed by the three principal elements of our executive compensation program.
In making compensation decisions, our Compensation Committee exercises its judgment on the overall level of compensation provided by this total compensation package as well as the mix of the three principal elements of compensation.
Base Salary
Our Compensation Committee reviews the base salary levels for our executive officers annually and makes such adjustments as it deems appropriate after taking into account the officer’s level and scope of responsibility and experience, company and individual performance, competitive market data, and internal pay equity considerations.
Annual Cash Incentive Compensation
Annual cash incentive compensation for key employees, including our NEOs, consists of cash awards under our short-term incentive plans. We have an annual cash incentive compensation plan applicable to all NEOs other than James R. Sneed, our Vice President of Ethanol Supply and Trading, and an annual cash incentive compensation plan applicable solely to Mr. Sneed. Participants are eligible for annual cash incentive compensation based upon the attainment of pre-established goals. Awards under the plans are based on up to three elements: financial performance, departmental performance and individual performance. Pacific Ethanol’s financial performance is an element in all participants’ awards, whereas one or both of the departmental performance and individual performance elements will also apply, depending on the particular participant. Our NEOs are evaluated under the plans based solely on the financial performance and individual performance elements because our Compensation Committee believes that these elements will best incent our NEOs to attain our short- and long-term financial and other business goals. The 2014 payout structure under our annual cash incentive compensation plans for our NEOs is set forth below:
| Target ($) | x | Performance Factor | = | Overall Payout | ||||
• Target $ = % of base salary • NEO Target %: Ø CEO: 70% Ø Other NEOs: 35-50% |
• Financial performance: Ø 80% weight Ø Min/max payout for Adjusted EBITDA (all NEOs): 0%/175% of target Ø Min/max payout for Kinergy’s Adjusted Net Income (Mr. Sneed only): 0%/855% of target • Individual performance: Ø 20% weight Ø Min/max payout (all NEOs): 0%/100% of target
|
• Minimum payout (all NEOs): 0% of target • Target Payout (all NEOs): 100% of target • Maximum payout (NEOs other than Mr. Sneed): 160% of target • Maximum payout (Mr. Sneed only): 500% of target | ||||||
| 68 |
Our Compensation Committee selected our annual cash incentive compensation plans as the vehicle for cash incentive compensation for 2014 for our executive officers because the Compensation Committee believes the plans properly incent our executive officers by focusing primarily on our financial performance, as further discussed below, while allowing awards to reflect other important factors, including an executive officer’s individual performance and accomplishments. The retention of such flexibility may preclude certain of our annual awards from qualifying as performance-based compensation under Internal Revenue Code Section 162(m), resulting in the loss of income tax deductibility to the extent annual compensation exceeds $1.0 million.
Financial Performance
We have two annual cash incentive compensation plans, one applicable to all NEOs other than James R. Sneed, our Vice President of Ethanol Supply and Trading, and a separate plan applicable solely to Mr. Sneed. Our annual cash incentive compensation plan applicable to all NEOs other than Mr. Sneed uses our Adjusted EBITDA as its sole financial performance element. Our annual cash incentive compensation plan applicable to Mr. Sneed uses our Adjusted EBITDA and Kinergy’s Adjusted Net Income as its financial performance elements.
Pacific Ethanol—Adjusted EBITDA
The financial performance element of our annual cash incentive compensation plan applicable to all NEOs other than Mr. Sneed is based on an Adjusted EBITDA goal established by our Compensation Committee. The Compensation Committee is expected to change the numerical Adjusted EBITDA goal from year to year and may include financial performance measures other than Adjusted EBITDA in future years.
The Compensation Committee selected the Adjusted EBITDA metric because it believed that earnings before interest, taxes, depreciation and amortization, or EBITDA, is an industry-accepted measure of overall financial performance and demonstrates our financial performance and ability to reinvest in our business. The Compensation Committee departed from the standard EBITDA metric because it believed Adjusted EBITDA better reflects Pacific Ethanol’s financial performance on a year-over-year basis by excluding non-recurring charges for debt extinguishments and warrant inducements and by excluding non-cash charges for fair value adjustments. Use of the Adjusted EBITDA metric also allowed the Compensation Committee to incent our executive officers to focus on factors over which they can exert control, such as attaining higher margins through managing production volumes relative to both ethanol and co-product sales prices and production input costs, increasing production efficiencies, and controlling operating costs such as selling, general and administrative expenses, all of which impact Adjusted EBITDA. The Compensation Committee also desired to omit from the financial performance metric factors over which the executive officers have less control and which it viewed as less relevant to measuring year-over-year financial performance, such as interest expense, taxes, depreciation and amortization.
The financial performance element for 2014 was weighted at 80% and was the most heavily-weighted element. This element was assigned the highest weighting because the principal purpose of our annual cash incentive compensation plan is to motivate and reward participants for achieving our financial goals, while allowing significantly higher payouts for 2014 of up to 175% of the targeted payout amount for financial outperformance, and to align participant and stockholder interests.
| 69 |
Kinergy—Adjusted EBITDA and Kinergy’s Adjusted Net Income
The financial performance element of Kinergy’s annual cash incentive compensation plan applicable to Mr. Sneed is based on Adjusted EBITDA and Kinergy’s Adjusted Net Income goals established by our Compensation Committee. The Adjusted EBITDA goal applicable to Kinergy’s annual cash incentive compensation plan is the same as the goal for our annual cash incentive compensation plan applicable to all other NEOs. The Compensation Committee is expected to change Pacific Ethanol’s numerical Adjusted EBITDA and Kinergy’s numerical Adjusted Net Income goals from year to year and may include financial performance measures other than Adjusted EBITDA and Kinergy’s Adjusted Net Income in future years.
The Compensation Committee selected the Adjusted EBITDA metric as a financial performance element of Kinergy’s annual cash incentive compensation plan for the same reasons noted above with regard to our annual cash incentive compensation plan applicable to all NEOs other than Mr. Sneed and because the Compensation Committee wanted to incent Mr. Sneed to benefit Pacific Ethanol as a whole through his performance and enable Mr. Sneed to benefit from overall company performance.
The Compensation Committee selected Kinergy’s Adjusted Net Income metric as an additional financial performance element of Kinergy’s annual cash incentive compensation plan because our overall objective for Kinergy in 2014 was for Kinergy to contribute higher net income to Pacific Ethanol as a whole to boost overall company performance by increasing Kinergy’s market share while focusing on Kinergy’s profitability. The Compensation Committee departed from the standard net income metric because it believed Kinergy’s Adjusted Net Income better reflects Kinergy’s financial performance by excluding the effects of legacy tax loss carryforwards while also maintaining a uniform methodology of measuring Kinergy’s Adjusted Net Income against budgeted net income by excluding mid-year changes in policy or practice. The Compensation Committee believed that excluding these mid-year changes would best incent Mr. Sneed by determining Kinergy’s Adjusted Net Income under the same assumptions as budgeted net income. A departure from these assumptions mid-year to make changes in policy or practice could have affected the calculation of Kinergy’s Adjusted Net Income and therefore unfairly increase or decrease Mr. Sneed’s annual cash incentive compensation. For 2014, Kinergy had no mid-year changes in policy or practice that affected the calculation of Kinergy’s Adjusted Net Income.
The financial performance element for 2014 was weighted at 80% and was the most heavily-weighted element. This element was assigned the highest weighting because the principal purpose of our annual cash incentive compensation plan for Mr. Sneed is to motivate and reward him for achieving our financial goals, while allowing significantly higher payouts for 2014 of up to 600% of target compensation for Kinergy and Pacific Ethanol financial outperformance, and to align the interests of Mr. Sneed and our stockholders.
Departmental Performance
The departmental performance element is based on quantitative criteria and subjective elements established by our executive committee. The extent to which a department is deemed to have achieved its performance goals is determined by our executive committee in consultation with our Compensation Committee. Payout under the departmental element is in the discretion of our Compensation Committee and was funded at a rate of 0% to 100% of the participant’s targeted payout amount for the element. Although our overall NEO performance evaluations included many departmental factors, our Compensation Committee weighted the departmental performance element at 0% for 2014 for our NEOs, focusing instead solely on financial performance and individual performance by the NEOs because the Compensation Committee believed those two performance elements, and their respective weightings, would best incent our NEOs in a manner consistent with our compensation philosophy and objectives.
| 70 |
Individual Performance
The individual performance element is based on individual participant goals based on quantitative criteria and subjective elements established by each participant’s supervisor, in consultation with our executive committee. The extent to which a participant is deemed to have achieved his or her individual performance goals is determined by our executive committee in consultation with the participant’s supervisor. However, the extent to which a participant who is an executive officer is deemed to have achieved his or her individual performance goals is recommended by our Chief Executive Officer but ultimately determined by our Compensation Committee. Payout under the individual performance element is in the discretion of the Compensation Committee and was funded at a rate of 0% to 100% of the participant’s targeted payout amount for the element.
Long-Term Equity Incentive Compensation
Long-term equity incentive compensation for key employees, including our NEOs, generally consists of awards of restricted stock under our 2006 Plan. Although we granted stock options in the past, we primarily made awards of restricted stock under our 2006 Plan as a means of providing long-term equity incentive compensation. We believe that shares of restricted stock are less subject to market volatility than stock options and therefore offer a more balanced and competitive equity compensation arrangement.
The Compensation Committee approves equity awards for our NEOs in connection with the annual review of their individual performance and overall compensation. The annual awards are typically made near the end of the first quarter and represent the majority of the shares granted for the year under our equity incentive compensation program. Each award is designed primarily as a retention tool, requiring the executive to remain with Pacific Ethanol for at least one year to receive the benefit of one-third of the award on partial vesting and at least three years to receive the full benefit of the award on full vesting. We believe our equity incentive compensation aligns the interests of our NEOs with those of our stockholders and provides each NEO with a significant incentive to manage our company from the perspective of an owner with an equity stake in the business by tying significant portions of the recipients’ compensation to the market price of our common stock.
Awards of restricted stock typically vest annually over a three-year period of continued service measured from the grant date. Each award of restricted stock will provide a return to the NEO only to the extent he or she remains employed with us during the partial or full vesting period.
In making long-term equity incentive awards, our Compensation Committee sets a target value for the award for each executive officer based on its judgment about the factors used in setting executive officer total compensation described under “Compensation Philosophy and Objectives” above as well as our Compensation Committee’s judgment regarding the desired mix of base salary, annual cash incentives and long-term equity incentives. Our Compensation Committee also considers outstanding vested and unvested equity awards to executive officers, the stock ownership levels of executive officers and the potential dilutive effect on our stockholders.
Once our Compensation Committee determines the target value of a recipient’s long-term equity incentive award, we establish the specific number of shares subject to the award by dividing the target value of the equity grant by the closing price of a share of our common stock on the date of grant. This is the same valuation model we use for our financial statements determined in accordance with the Financial Accounting Standards Board’s Accounting Standards Codification Topic 718.
| 71 |
Other Compensation and Benefits
We do not currently offer retirement or pension benefits or any non-qualified deferred compensation plans. Instead, we provide our NEOs with the opportunity to accumulate retirement income primarily through a defined contribution plan and through the appreciation of the value of their equity awards. Consistent with our pay-for-performance compensation philosophy, we do not provide our executive officers with any significant perquisites, other than certain travel perquisites or those offered to our employees generally. Except as noted below, our NEOs are eligible to participate in the following employee benefit programs on the same basis as all other regular employees:
401(k) Plan. Each of our NEOs and other salaried employees are eligible to participate in a defined contribution plan qualified under Section 401(k) of the Internal Revenue Code. In 2014, we contributed $1.00 for each $1.00 of employee contributions, up to a maximum contribution of 3.0% of the participant’s eligible compensation, and we contributed $0.50 for each $1.00 of employee contributions for contributions in excess of 3.0% of the participant’s eligible compensation up to a maximum of 5.0% of the participant’s eligible compensation. Our maximum matching contribution during 2014 was $9,800 per year. We have included our contributions to the accounts of the NEOs for the applicable years in the “All Other Compensation” column in the Summary Compensation Table below to the extent “All Other Compensation” exceeded $10,000 for a particular NEO.
Group Life, Health and Disability Plans. We have established group life, health and disability plans for our employees. The NEOs may participate in these plans on the same basis as other employees.
Perquisites and Other Benefits. We furnish a limited number of perquisites to our NEOs, of which only travel-related perquisites meet the threshold for reporting in the “All Other Compensation” column in the Summary Compensation Table under the rules of the Securities and Exchange Commission. Our corporate travel policy, applicable only to certain executive officers, covers expenses of our Vice President, General Counsel and Secretary and our Vice President of Ethanol Supply and Trading for business travel from their out-of-state residences to our principal offices in Sacramento, California as well as expenses for local lodging. Our travel policy does not provide for a “gross-up” for taxes on amounts we reimburse under the policy that are taxable compensation to the employee.
Other Policies and Factors Affecting Executive Officer Compensation
Severance and Change-in-Control Arrangements
We have established executive employment agreements that include severance and change-in-control arrangements with each of our NEOs. These arrangements set forth the terms and conditions upon which these NEOs would be entitled to receive certain benefits upon termination of employment.
These agreements are intended to help us attract and retain executive talent in a competitive marketplace; enhance the prospects that the NEOs would remain with us and devote their attention to our performance in the event of a potential change in control; foster their objectivity in considering a change-in-control proposal; and facilitate their attention to our affairs without the distraction that could arise from the uncertainty inherent in severance and change-in-control situations.
The disclosure below under “—Summary Compensation Table—Executive Employment Agreements”, “—Severance and Change in Control Arrangements with Named Executive Officers” and “—Calculation of Potential Payments upon Termination or Change in Control” explains in detail the benefits under these arrangements and the circumstances under which these NEOs would be entitled to them.
| 72 |
Trading Policy
Our insider trading policy prohibits all employees, officers and directors from engaging in any short sale of Pacific Ethanol securities, as well as any transaction involving puts, calls, collars, forward sales contracts, warrants or other options on Pacific Ethanol securities. Additionally, our executive officers are restricted from pledging Pacific Ethanol securities as collateral for a loan.
Tax Considerations
Section 162(m) of the Internal Revenue Code generally disallows a tax deduction to publicly-held corporations for compensation paid to certain of their executive officers to the extent such compensation exceeds $1.0 million per covered officer in any year. However, this limitation only applies to compensation that is not considered performance-based for purposes of Section 162(m). Certain types of performance-based compensation are excluded from the $1.0 million deduction limit if specific requirements are met. As discussed earlier, certain amounts paid under our annual cash incentive compensation plan for 2014 qualified as such performance-based compensation. In addition, our time-based grants of restricted stock awarded to our executive officers do not qualify as such performance-based compensation, because their vesting is not tied to any performance metric.
Our Compensation Committee generally considers the impact of Section 162(m) when designing our cash and equity incentive compensation programs so that awards may be granted under these programs in a manner that qualifies them as performance-based for purposes of Section 162(m). However, we believe that in establishing the cash and equity incentive compensation programs for our executive officers, the potential tax deductibility of the compensation payable under those programs should be only one of a number of relevant factors taken into consideration, and not the sole governing factor. We believe it is important to maintain cash and equity incentive compensation at the levels and with the design features needed to attract and retain the executive officers essential to our success, even if all or part of that compensation may not be deductible by reason of the Section 162(m) limitation. Accordingly, our Compensation Committee may grant awards under which payments may not be deductible under Section 162(m) when the Compensation Committee determines that such non-deductible arrangements are otherwise in our best interests and in furtherance of the objectives of our executive compensation programs.
Compensation Recovery Policies
Pursuant to Section 304 of the Sarbanes-Oxley Act of 2002, if we are required as the result of misconduct to restate our financial results due to our material noncompliance with any financial reporting requirements under the federal securities laws, our Chief Executive Officer and Chief Financial Officer may be legally required to reimburse us for any bonus or incentive-based or equity-based compensation they receive. We anticipate additional requirements in this regard once the provisions of the Dodd-Frank Wall Street Reform and Consumer Protection Act have been adopted and we intend to fully comply with the requirements.
Compensation Decisions for 2014
Our Compensation Committee established compensation for our NEOs in 2014 in a manner consistent with our executive compensation philosophy and objectives. Our Compensation Committee’s decisions were based upon its judgment about our financial and other business performance for 2013, expected financial and other business performance for 2014, and the positions, scope and importance of the roles of our NEOs and how their positions compared to other Pacific Ethanol executive officers and personnel. Our Compensation Committee’s decisions were also based on comparing and adjusting the compensation of our NEOs in reference to the compensation of similarly situated personnel at other organizations through a benchmarking process. See “Benchmarking” above. The Compensation Committee also considered certain other factors such as budget constraints and executive officer recommendations. Through these efforts, our Compensation Committee established a desired level and mix of total compensation.
In setting the compensation of our executive officers, except as noted below, our Compensation Committee did not adhere to any specific formulas tied to market data nor did it rely on market data to determine the specific mix of compensation components. Instead, our Compensation Committee used this data as a guide and a resource for tracking executive compensation trends.
| 73 |
Total Compensation
In implementing its compensation philosophy and objectives for 2014, our Compensation Committee categorized each executive officer into one of three tiers based on its view of the importance and scope of the executive officer’s role and how his position compares to other Pacific Ethanol executive officers and personnel. The Tier 1 category included only our Chief Executive Officer. The Tier 2 category included our Chief Operating Officer, our Chief Financial Officer and our Vice President, General Counsel and Secretary. The Tier 3 category included all other executive officers, including our Vice President of Ethanol Supply and Trading.
Our Compensation Committee targeted total compensation for Neil M. Koehler, our Chief Executive Officer, as the sole member of the Tier 1 category, at approximately the 75th percentile, targeted total compensation for Michael D. Kandris, our Chief Operating Officer, Bryon T. McGregor, our Chief Financial Officer, and Christopher W. Wright, our Vice President, General Counsel and Secretary, as members of the Tier 2 category, at above the 50th percentile but below the 75th percentile, and targeted total compensation for our other executive officers, including James R. Sneed, our Vice President of Ethanol Supply and Trading, as a member of the Tier 3 category, at approximately the 50th percentile, in each case relative to similarly situated personnel, or groups of personnel in the case of the Tier 2 category, at our third-party survey group companies based on the market data provided by Hay Group.
Our Compensation Committee viewed the importance and scope of the Tier 2 executive officers’ roles and how their respective positions compare to other Pacific Ethanol executive officers and personnel as too closely aligned to make meaningful compensation distinctions among the Tier 2 executive officers. In grouping the Tier 2 executive officers together, our Compensation Committee also desired to promote a collaborative environment among the executive officers who work most closely together as a team. In determining the relevant percentile comparisons for the Tier 2 officers, our Compensation Committee used compensation data from our third-party survey group companies corresponding to each of the three officer positions within the Tier 2 category. This methodology resulted in three different total compensation figures at the 50th and 75th percentile levels given the different officer positions of the Tier 2 executive officers. Consistent with our Compensation Committee’s view that the Tier 2 executive officers were too closely aligned to make meaningful compensation distinctions among them, and to promote a collaborative working environment, our Compensation Committee selected the middle of the three 50th percentile total compensation figures by discarding the highest and lowest compensation figures rather than viewing each officer separately against his respective market data. The resulting single total compensation figure, increased for the reasons discussed below, was then used to target total compensation for all three of our Tier 2 executive officers.
The Compensation Committee determined the 75th percentile was an appropriate benchmark for Mr. Koehler because of Mr. Koehler’s exceptional industry expertise, his background as a founder of Pacific Ethanol and that his continued leadership of Pacific Ethanol is especially valuable in light of these factors, as well as our Compensation Committee’s view that Mr. Koehler’s compensation is appropriate relative to other public company Chief Executive Officers in our industry. The Compensation Committee determined that total compensation for the Tier 2 executive officers above the 50th percentile and below the 75th percentile was appropriate because that level is consistent with the Compensation Committee’s intention for 2014 to target total compensation for our Tier 2 executive officers at or around the median of total compensation of similarly situated personnel at other organizations, but increased to compensate the Tier 2 executive officers for lower base salaries relative to median base salaries of similarly situated executive officers. The additional targeted compensation above the 50th percentile took the form of long-term equity incentive compensation, further tying the Tier 2 executive officers’ compensation to company performance. The Compensation Committee determined the 50th percentile was an appropriate benchmark for our Tier 3 executive officers because that level is consistent with the Compensation Committee’s intention for 2014 to target total compensation for our Tier 3 executive officers at the median of total compensation of similarly situated personnel at other organizations.
| 74 |
Base Salary
Given our history of losses and uncertainties regarding future performance, and to reduce the impact on our financial position in the event of poor 2014 performance, our Compensation Committee decided to limit base salary adjustments for executive officers to a 3% increase over 2013 levels. This resulted in higher targeted long-term equity incentive compensation for 2014 for our Tier 1 and Tier 2 executive officers necessary to attain total compensation at the levels targeted.
Annual Cash Incentive Compensation
In setting total compensation for 2014, our Compensation Committee determined that our executive officers, other than Mr. Sneed, were paid at significantly lower levels than similarly situated personnel at other organizations largely due to the absence of regular payouts under an annual cash incentive compensation plan. Our Compensation Committee concluded that it was important to alter the payout criteria of the annual cash incentive compensation in order to assure that annual cash incentive compensation is a meaningful part of the total mix of compensation in 2014 and in future years in order to bring total compensation to competitive levels and properly incent performance. We also revised our annual cash incentive compensation plan for Kinergy with compensation levels more aligned with the compensation of similarly situated personnel at other organizations consistent with market data provided by our compensation consultants. In addition, we did not impose an overall dollar cap for Kinergy’s bonus plan for 2013, resulting in high bonus compensation paid to Mr. Sneed for that year. Our Compensation Committee revised Kinergy’s annual cash incentive compensation plan to include an overall dollar cap for 2014.
Our Compensation Committee targeted 2014 annual cash incentive compensation at 70% of base salary for our Chief Executive Officer, at 50% of base salary for our Chief Operating Officer, our Chief Financial Officer and our Vice President, General Counsel and Secretary and at approximately 35% of base salary for our Vice President of Ethanol Supply and Trading. These levels were consistent with the targeted percentage bonus amounts included in each executive officer’s employment agreement other than our Vice President of Ethanol Supply and Trading, whose employment agreement does not include a targeted percentage bonus amount.
As discussed above, awards under our annual cash incentive compensation plans are based on up to three elements: financial performance, departmental performance and individual performance. For 2014, our Compensation Committee weighted for each of our NEOs, financial performance at 80%, departmental performance at 0% and individual performance at 20%. In doing so, our Compensation Committee desired to incent most heavily activities that lead to strong overall financial performance while still rewarding individual performance.
Pacific Ethanol’s Annual Cash Incentive Compensation Plan
For our annual cash incentive compensation plan applicable to all NEOs other than James R. Sneed, our Vice President of Ethanol Supply and Trading, our Compensation Committee established our 2014 financial performance goal of Adjusted EBITDA at $49.6 million based on our projections established early in the year, and approved a matrix with a sliding scale of achievement and payout opportunities in which higher Adjusted EBITDA corresponded to higher levels of goal achievement and payouts. Our Adjusted EBITDA goal of $49.6 million was viewed as attainable but highly aspirational at the time the projections were finalized. Payout under the financial performance element was non-discretionary and was funded at a rate of 0% to 175% of the participants’ targeted payout amount for the financial performance element based on the actual level of Adjusted EBITDA compared to the Adjusted EBITDA goal. To achieve 100% of the Adjusted EBITDA performance goal, we had to achieve Adjusted EBITDA of $49.6 million for 2014; however, the matrix provided payout opportunities for partial achievement (e.g., payout as low as 40%) and overachievement (e.g., payout as high as 175%) of the Adjusted EBITDA goal at specified Adjusted EBITDA levels.
| 75 |
The Compensation Committee established for 2014 a maximum aggregate plan pool of up to $1.8 million for all performance elements with a targeted payout amount of $1.2 million if all personnel covered by the plan attained 100% of their financial, departmental and individual performance goals. The $0.6 million difference between the maximum aggregate plan pool of up to $1.8 million and the targeted payout amount of $1.2 million was available if financial performance exceeded the Adjusted EBITDA goal by the maximum amount of 175%.
A minimum level of $39.7 million of Adjusted EBITDA, or 80% of our Adjusted EBITDA goal, was required to be satisfied before there was any payout under the financial performance element. This feature was intended to assure that we achieved an acceptable minimum level of financial performance before annual cash incentives could be paid to any participant, including our executive officers. At the 80% Adjusted EBITDA level, the targeted aggregate payout was $0.3 million, or 40% of the portion of the plan pool attributable to financial performance. At the 100% Adjusted EBITDA level, the targeted aggregate payout was $0.8 million, or 100% of the portion of the plan pool attributable to financial performance. From the 100% level, the amounts increased in 5% increments to a maximum of 175% of our Adjusted EBITDA goal so that at the 175% Adjusted EBITDA level, the targeted aggregate payout was $1.4 million, or 175% of the portion of the plan pool attributable to financial performance.
Kinergy’s Annual Cash Incentive Compensation Plan
For our annual cash incentive compensation plan applicable solely to Mr. Sneed, our Compensation Committee established two financial performance goals for 2014, specifically, Kinergy’s Adjusted Net Income goal of $2.9 million and our Adjusted EBITDA goal of $49.6 million. Of the 80% weighting attributable to our financial performance under this plan, 50% was attributable to the Kinergy’s Adjusted Net Income goal and 30% was attributable to our Adjusted EBITDA goal. Kinergy’s annual cash incentive compensation plan operates in a manner substantially the same as our annual cash incentive compensation plan applicable to our other NEOs, including with respect to matrices with sliding scales of achievement and payout opportunities in which higher levels of Kinergy’s Adjusted Net Income and our Adjusted EBITDA corresponded to higher levels of goal achievement and payouts. The Compensation Committee established for 2014 a maximum aggregate plan pool of up to $400,000 for all performance elements with a targeted payout amount of $80,000 if Mr. Sneed attained 100% of his financial and individual performance goals. The $320,000 difference between the maximum aggregate plan pool of up to $400,000 and the targeted payout amount of $80,000 was available if financial performance exceeded Kinergy’s Adjusted Net Income goal by the maximum amount of 855% and financial performance exceeded our Adjusted EBITDA goal by the maximum amount of 175%. A minimum level of $2.3 million of Kinergy’s Adjusted Net Income, or 80% of Kinergy’s Adjusted Net Income goal, was required to be satisfied before there was any payout under Kinergy’s Adjusted Net Income financial performance element.
Long-Term Equity Incentive Compensation
Our Compensation Committee targeted 2014 long-term equity incentive compensation for our NEOs at a level equal to the balance of the executive officer’s targeted total compensation in excess of the sum of the executive officer’s base salary and targeted annual cash incentive compensation. Accordingly, in setting 2014 long-term equity incentive compensation, our Compensation Committee subtracted the sum of the executive officer’s base salary and targeted annual cash incentive compensation from targeted total compensation and established the specific number of shares subject to the award by dividing the target value of the equity grant by the closing price of a share of our common stock on the date of grant.
| 76 |
Individual Executive Officer Compensation Targets
Target direct compensation for each of our NEOs for 2014 is set forth below.
Specific results against performance objectives that influenced the amount and mix of our NEOs total direct compensation for 2014 included record Adjusted EBITDA and higher than budgeted Kinergy Adjusted Net Income for 2014 and full attainment by our NEOs of their respective individual performance goals under our annual cash incentive compensation plans. We achieved 192% of our Adjusted EBITDA goal for 2014, resulting in a payout under our annual cash incentive compensation plans to all NEOs at 175% of the targeted payout levels for that performance measure. We achieved 140% of Kinergy’s Adjusted Net Income goal for 2014 resulting in a payout under Kinergy’s annual cash incentive compensation plan to James R. Sneed at 221% of the targeted payout level for that performance measure.
Neil M. Koehler, Chief Executive Officer and President
The following table and chart shows Mr. Koehler’s direct target compensation for 2014 and 2013, as well as the positioning of his 2014 direct target compensation relative to similarly situated personnel at our third-party survey group companies based on the market data provided by Hay Group:
| Change | ||||||||||||||||
| Neil M. Koehler | 2014 | 2013 | Dollars | Percent | ||||||||||||
| Base Salary | $ | 395,906 | $ | 384,375 | $ | 11,531 | 3.0% | |||||||||
| Annual Cash Incentive Compensation | ||||||||||||||||
| Target Percent of Base Salary | 70.0% | 70.0% | – | |||||||||||||
| Target Dollars | $ | 277,134 | $ | 269,063 | $ | 8,071 | 3.0% | |||||||||
| Long-Term Equity Incentive Compensation | ||||||||||||||||
| Target Percent of Base Salary | 126.3% | 130.1% | (2.9)% | |||||||||||||
| Target Dollars | $ | 500,000 | $ | 500,000 | $ | – | – | |||||||||
| Target Total Direct Compensation | $ | 1,173,040 | $ | 1,153,438 | $ | 19,602 | 1.7% | |||||||||
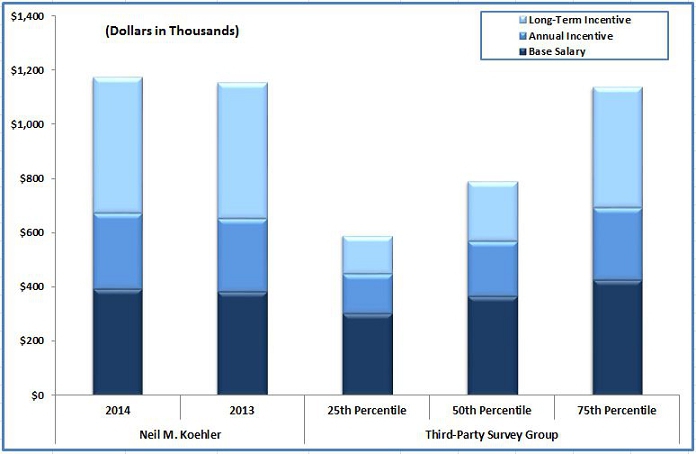
Our Compensation Committee increased Mr. Koehler’s target total direct compensation by 1.7% for 2014 as compared to 2013. The increase in target compensation for 2014 resulted from an annual 3% increase of Mr. Koehler’s base salary, which also increased Mr. Koehler’s targeted annual cash incentive compensation by an equivalent amount. In addition, as discussed above, our Compensation Committee established Mr. Koehler’s target total direct compensation for 2014 at approximately the 75th percentile relative to similarly situated personnel at our third-party survey group companies based on the market data provided by Hay Group.
| 77 |
Michael D. Kandris, Chief Operating Officer
The following table and chart shows Mr. Kandris’ direct target compensation for 2014 and 2013, as well as the positioning of his 2014 direct target compensation relative to similarly situated personnel at our third-party survey group companies based on the market data provided by Hay Group:
| Change | ||||||||||||||||
| Michael D. Kandris | 2014 | 2013 | Dollars | Percent | ||||||||||||
| Base Salary | $ | 253,380 | $ | 246,000 | $ | 7,380 | 3.0% | |||||||||
| Annual Cash Incentive Compensation | ||||||||||||||||
| Target Percent of Base Salary | 50.0% | 50.0% | – | |||||||||||||
| Target Dollars | $ | 126,690 | $ | 123,000 | $ | 3,690 | 3.0% | |||||||||
| Long-Term Equity Incentive Compensation | ||||||||||||||||
| Target Percent of Base Salary | 67.5% | 56.9% | 18.6% | |||||||||||||
| Target Dollars | $ | 171,030 | $ | 140,000 | $ | 31,030 | 22.2% | |||||||||
| Target Total Direct Compensation | $ | 551,100 | $ | 509,000 | $ | 42,100 | 8.3% | |||||||||
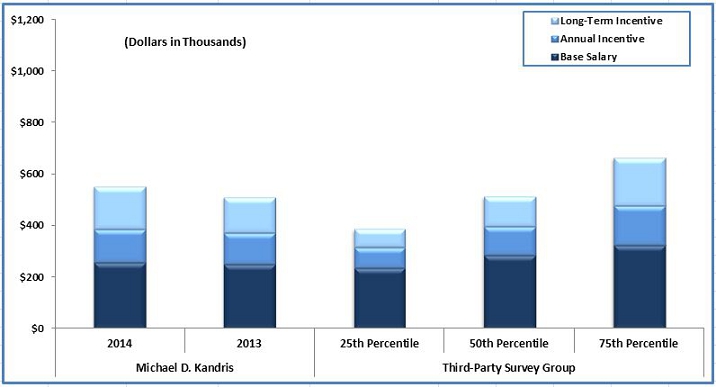
Our Compensation Committee increased Mr. Kandris’ target total direct compensation by 8.3% for 2014 as compared to 2013. As discussed above, our Compensation Committee established Mr. Kandris’ target total direct compensation at above the 50th percentile and below the 75th percentile relative to similarly situated personnel at our third-party survey group companies based on the market data provided by Hay Group, which resulted in higher target total direct compensation for 2014 as compared to 2013.
| 78 |
Bryon T. McGregor, Chief Financial Officer
The following table and chart shows Mr. McGregor’s direct target compensation for 2014 and 2013, as well as the positioning of his 2014 direct target compensation relative to similarly situated personnel at our third-party survey group companies based on the market data provided by Hay Group:
| Change | ||||||||||||||||
| Bryon T. McGregor | 2014 | 2013 | Dollars | Percent | ||||||||||||
| Base Salary | $ | 253,380 | $ | 246,000 | $ | 7,380 | 3.0% | |||||||||
| Annual Cash Incentive Compensation | ||||||||||||||||
| Target Percent of Base Salary | 50.0% | 50.0% | – | |||||||||||||
| Target Dollars | $ | 126,690 | $ | 123,000 | $ | 3,690 | 3.0% | |||||||||
| Long-Term Equity Incentive Compensation | ||||||||||||||||
| Target Percent of Base Salary | 67.5% | 56.9% | 18.6% | |||||||||||||
| Target Dollars | $ | 171,030 | $ | 140,000 | $ | 31,030 | 22.2% | |||||||||
| Target Total Direct Compensation | $ | 551,100 | $ | 509,000 | $ | 42,100 | 8.3% | |||||||||
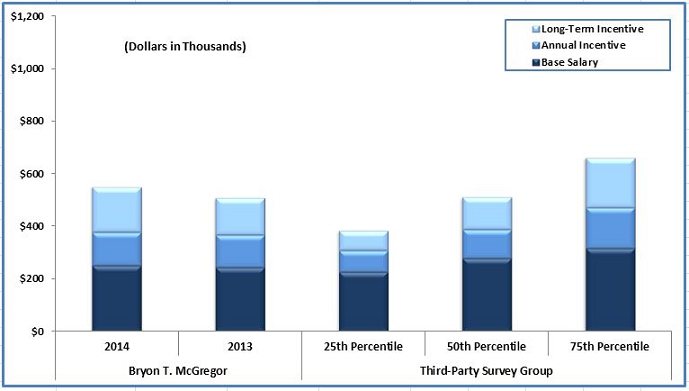
Our Compensation Committee increased Mr. McGregor’s target total direct compensation by 8.3% for 2014 as compared to 2013. As discussed above, our Compensation Committee established Mr. McGregor’s target total direct compensation at above the 50th percentile and below the 75th percentile relative to similarly situated personnel at our third-party survey group companies based on the market data provided by Hay Group, which resulted in higher target total direct compensation for 2014 as compared to 2013.
| 79 |
Christopher W. Wright, Vice President, General Counsel and Secretary
The following table and chart shows Mr. Wright’s direct target compensation for 2014 and 2013, as well as the positioning of his 2014 direct target compensation relative to similarly situated personnel at our third-party survey group companies based on the market data provided by Hay Group:
| Change | ||||||||||||||||
| Christopher W. Wright | 2014 | 2013 | Dollars | Percent | ||||||||||||
| Base Salary | $ | 253,380 | $ | 246,000 | $ | 7,380 | 3.0% | |||||||||
| Annual Cash Incentive Compensation | ||||||||||||||||
| Target Percent of Base Salary | 50.0% | 50.0% | – | |||||||||||||
| Target Dollars | $ | 126,690 | $ | 123,000 | $ | 3,690 | 3.0% | |||||||||
| Long-Term Equity Incentive Compensation | ||||||||||||||||
| Target Percent of Base Salary | 67.5% | 56.9% | 18.6% | |||||||||||||
| Target Dollars | $ | 171,030 | $ | 140,000 | $ | 31,030 | 22.2% | |||||||||
| Target Total Direct Compensation | $ | 551,100 | $ | 509,000 | $ | 42,100 | 8.3% | |||||||||
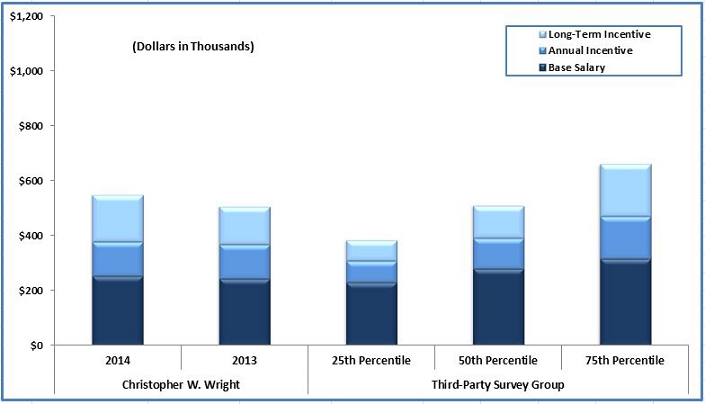
Our Compensation Committee increased Mr. Wright’s target total direct compensation by 8.3% for 2014 as compared to 2013. As discussed above, our Compensation Committee established Mr. Wright’s target total direct compensation at above the 50th percentile and below the 75th percentile relative to similarly situated personnel at our third-party survey group companies based on the market data provided by Hay Group, which resulted in higher target total direct compensation for 2014 as compared to 2013.
| 80 |
James R. Sneed, Vice President of Ethanol Supply and Trading
The following table and chart shows Mr. Sneed’s direct target compensation for 2014 and 2013, as well as the positioning of his 2014 direct target compensation relative to similarly situated personnel at our third-party survey group companies based on the market data provided by Hay Group:
| Change | ||||||||||||||||
| James R. Sneed | 2014 | 2013 | Dollars | Percent | ||||||||||||
| Base Salary | $ | 226,600 | $ | 220,000 | $ | 6,600 | 3.0% | |||||||||
| Annual Cash Incentive Compensation | ||||||||||||||||
| Target Percent of Base Salary | 35.3% | 13.6% | 159.6% | |||||||||||||
| Target Dollars | $ | 80,000 | $ | 30,000 | $ | 50,000 | 166.7% | |||||||||
| Long-Term Equity Incentive Compensation | ||||||||||||||||
| Target Percent of Base Salary | 33.1% | 34.1% | (2.9)% | |||||||||||||
| Target Dollars | $ | 75,000 | $ | 75,000 | $ | – | – | |||||||||
| Target Total Direct Compensation | $ | 381,600 | $ | 325,000 | $ | 56,600 | 17.4% | |||||||||
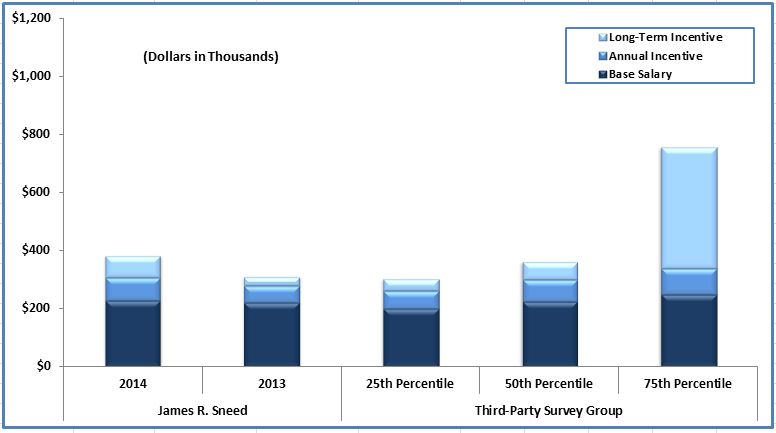
Our Compensation Committee increased Mr. Sneed’s target total direct compensation by 17.4% for 2014 as compared to 2013. As discussed above, our Compensation Committee established Mr. Sneed’s target total direct compensation for 2014 at the 50th percentile relative to similarly situated personnel at our third-party survey group companies based on the market data provided by Hay Group, which resulted in higher target total direct compensation for 2014 as compared to 2013. The increase in 2014 was primarily related to the implementation of a higher targeted annual cash incentive compensation payout based on Kinergy’s budgeted Adjusted Net Income for 2014. For 2013, we did not target any annual cash incentive compensation payout at Kinergy’s budgeted income level beyond a guaranteed minimum bonus of $30,000. Subject to the guaranteed minimum bonus, Kinergy had to attain higher than budgeted income before any amounts were payable to Mr. Sneed in 2013.
| 81 |
The following Compensation Committee Report is not deemed filed with the Securities and Exchange Commission. Notwithstanding anything to the contrary set forth in any of our previous filings made under the Securities Act of 1933, as amended (“Securities Act”), or under the Exchange Act that might incorporate future filings made by Pacific Ethanol under those statutes, the Compensation Committee Report will not be incorporated by reference into any such prior filings or into any future filings made by Pacific Ethanol under those statutes.
COMPENSATION COMMITTEE REPORT
The Compensation Committee has reviewed and discussed the foregoing Compensation Discussion and Analysis with management, and based on that review and discussion, the Compensation Committee recommended to the Board of Directors that the Compensation Discussion and Analysis be included in the annual report on Form 10-K for the year ended December 31, 2014.
Submitted by the Compensation Committee of the Board:
Larry D. Layne, Chair
Douglas L. Kieta
Terry L. Stone
John L. Prince
Compensation Risk Analysis
Our Compensation Committee, with the advice of its independent compensation consultant and input from management, reviewed the design of our employee compensation policies and practices and concluded that those policies and practices do not create risks that are reasonably likely to have a material adverse effect on us. Significant factors considered by our Compensation Committee in reaching its conclusion include:
| · | The mix and balance of base salary, annual cash incentive compensation and long-term equity incentive compensation, with an emphasis on long-term equity incentive compensation that increase along with our executives’ levels of responsibility; |
| · | A long-term equity incentive compensation program under which grants of restricted stock are made, which is intended to mitigate the risk of actions intended to capture short-term stock appreciation gains at the expense of sustainable total stockholder return over the longer-term; |
| · | Vesting of long-term equity incentive awards over a number of years; |
| · | Caps on annual cash incentive compensation; |
| · | Broad performance ranges for minimum, target and maximum financial performance goals with small tiered increments for annual cash incentive compensation that reduce the risk of accelerating or delaying revenue or expense recognition in order to satisfy the threshold or next tier for larger incentive payouts; |
| · | The financial performance measures we utilize under our annual cash incentive compensation plans, which include Adjusted EBITDA that accounts for controllable factors such as attaining higher margins through managing production volumes relative to both ethanol and co-product sales prices and production input costs, increasing production efficiencies, and controlling operating costs such as selling, general and administrative expenses; and Kinergy’s Adjusted Net Income that similarly accounts for controllable factors; and |
| · | Other features in our incentive programs that are intended to mitigate risks from our compensation program, particularly the risk of short-term decision-making. These features include the potential forfeiture of incentive awards by certain executive officers in the event of material noncompliance with any financial reporting requirements under the federal securities laws (other than to comply with changes in applicable accounting principles), including as a result of misconduct; and the ability of our Compensation Committee to exercise discretion to reduce or eliminate payouts under the discretionary components of our compensation program, such as the individual performance element in our annual cash incentive compensation plan, if it deems appropriate. |
| 82 |
Summary Compensation Table
The following table sets forth summary information concerning the compensation of our NEOs for all services rendered in all capacities to us for the years ended December 31, 2012, 2013 and 2014.
| Name
and Principal Position |
Year | Salary ($) |
Bonus ($) |
Stock |
Option |
All
Other |
Total ($) |
|||||||||||||||||||||
| Neil M. Koehler | 2014 | $ | 393,245 | $ | 443,415 | $ | 516,288 | $ | – | $ | – | $ | 1,352,948 | |||||||||||||||
| Chief Executive Officer | 2013 | $ | 384,375 | $ | 153,750 | $ | 665,283 | $ | 190,477 | $ | – | $ | 1,393,885 | |||||||||||||||
| and President(4) | 2012 | $ | 384,375 | $ | 40,000 | $ | – | $ | – | $ | – | $ | 424,375 | |||||||||||||||
| Michael D. Kandris | 2014 | $ | 251,677 | $ | 202,704 | $ | 176,588 | $ | – | $ | – | $ | 630,969 | |||||||||||||||
| Chief Operating Officer(5) | 2013 | $ | 246,000 | $ | 98,400 | $ | 112,179 | $ | 53,333 | $ | – | $ | 509,912 | |||||||||||||||
| 2012 | $ | – | $ | – | $ | – | $ | – | $ | – | $ | – | ||||||||||||||||
| Bryon T. McGregor | 2014 | $ | 252,027 | $ | 202,704 | $ | 176,588 | $ | – | $ | – | $ | 631,319 | |||||||||||||||
| Chief Financial Officer(6) | 2013 | $ | 246,000 | $ | 98,400 | $ | 191,183 | $ | 53,333 | $ | – | $ | 588,916 | |||||||||||||||
| 2012 | $ | 246,000 | $ | 23,370 | $ | – | $ | – | $ | – | $ | 269,370 | ||||||||||||||||
| Christopher W. Wright | 2014 | $ | 252,027 | $ | 202,704 | $ | 176,588 | $ | – | $ | 25,355 | (8) | $ | 656,674 | ||||||||||||||
| Vice President, General | 2013 | $ | 246,000 | $ | 98,400 | $ | 191,183 | $ | 53,333 | $ | 20,573 | (8) | $ | 609,489 | ||||||||||||||
| Counsel and Secretary(7) | 2012 | $ | 246,000 | $ | 23,370 | $ | – | $ | – | $ | – | $ | 269,370 | |||||||||||||||
| James R. Sneed | 2014 | $ | 225,077 | $ | 177,926 | $ | 77,434 | $ | – | $ | – | $ | 480,437 | |||||||||||||||
| Vice President of Ethanol | 2013 | $ | 220,000 | $ | 525,031 | $ | 43,635 | $ | 17,143 | $ | 17,969 | (8) | $ | 823,778 | ||||||||||||||
| Supply and Trading | 2012 | $ | – | $ | – | $ | – | $ | – | $ | – | $ | – | |||||||||||||||
_______________
| (1) | The amounts shown are the fair value of stock awards on the date of grant. Fair value of stock awards is calculated by multiplying the number of shares of stock granted by the closing price of our common stock on the date of grant. The shares of common stock were issued under our 2006 Plan. Information regarding the grants of restricted stock and vesting schedules for the named executive officers is included in the “Grants of Plan-Based Awards–2014” and “Outstanding Equity Awards at Fiscal Year-End−2014” tables below and the footnotes thereto. |
| (2) | The amounts shown are the aggregate grant date fair values of grants of stock options to the named executive officers pursuant to the provisions of Accounting Standards Codification (“ASC”) 718. For a discussion of valuation assumptions used in ASC 718 calculations, see “Note 10—Stock-Based Compensation” of the Notes to Consolidated Financial Statements included elsewhere in this report. The options were issued under our 2006 Plan. Information regarding the vesting schedules for the named executive officers is included in the footnotes to the “Outstanding Equity Awards at Fiscal Year-End−2014” table below. |
| (3) | Except as specifically noted, the value of perquisites and other personal benefits was less than $10,000 in aggregate for each of the named executive officers. |
| (4) | The value of the stock awards reported for 2013 includes $380,002 of awards made to Mr. Koehler in respect of his 2012 compensation that were granted in 2013. We did not have adequate shares available under our 2006 Plan to make awards in 2012. |
| (5) | Mr. Kandris was appointed as our Chief Operating Officer effective January 6, 2013. We paid Mr. Kandris $1,385 in fees for his services in 2013 as a member of our board of directors. We paid Mr. Kandris $239,135 in consideration of services provided to us in 2012 under a consulting arrangement. In addition, we paid Mr. Kandris $36,000 in fees for his service in 2012 as a member of our board of directors. None of the foregoing amounts are included in the table above. Also, of the stock awards granted to Mr. Kandris in 2013, an award of 10,000 shares of our common stock on January 4, 2013 having an aggregate grant date fair value of $53,900, calculated based on the fair market value of our common stock on the applicable grant date, was made in respect of Mr. Kandris’ service as a member of our Board in 2012. |
| (6) | The value of the stock awards reported for 2013 includes $133,004 of awards made to Mr. McGregor in respect of his 2012 compensation that were granted in 2013. We did not have adequate shares available under our 2006 Plan to make awards in 2012. |
| (7) | The value of the stock awards reported for 2013 includes $133,004 of awards made to Mr. Wright in respect of his 2012 compensation that were granted in 2013. We did not have adequate shares available under our 2006 Plan to make awards in 2012. |
| (8) | Amount represents perquisites or personal benefits relating to payment of or reimbursement of commuting expenses from the executive officer’s home to our corporate office locations in Sacramento, California, and housing and other living expenses. |
| 83 |
Executive Employment Agreements
Neil M. Koehler
Our Amended and Restated Executive Employment Agreement with Mr. Koehler dated as of December 11, 2007 provides for at-will employment as our President and Chief Executive Officer. Mr. Koehler initially received a base salary of $300,000 per year, which was increased to $375,000 effective March 1, 2008, further increased to $384,375 effective April 3, 2011, further increased to $395,906 on March 5, 2014 and further increased to $407,783 on February 15, 2015, and is eligible to receive an annual discretionary cash bonus of up to 70% of his base salary, to be paid based upon performance criteria set by the Board. For 2013, we paid Mr. Koehler a discretionary cash bonus based on our 2013 performance. For 2014, we paid Mr. Koehler a cash bonus under our annual cash incentive compensation program based on our 2014 performance.
Upon termination by Pacific Ethanol without cause, resignation by Mr. Koehler for good reason or upon Mr. Koehler’s disability, Mr. Koehler is entitled to receive (i) severance equal to twelve months of base salary, (ii) continued health insurance coverage for twelve months, and (iii) accelerated vesting of 25% of all shares or options subject to any equity awards granted to Mr. Koehler prior to Mr. Koehler’s termination which are unvested as of the date of termination. However, if Mr. Koehler is terminated without cause or resigns for good reason within three months before or twelve months after a change in control, Mr. Koehler is entitled to (a) severance equal to eighteen months of base salary, (b) continued health insurance coverage for eighteen months, and (c) accelerated vesting of 100% of all shares or options subject to any equity awards granted to Mr. Koehler prior to Mr. Koehler’s termination that are unvested as of the date of termination.
The term “for good reason” is defined in the Amended and Restated Executive Employment Agreement as (i) the assignment to Mr. Koehler of any duties or responsibilities that result in the material diminution of Mr. Koehler’s authority, duties or responsibility, (ii) a material reduction by Pacific Ethanol in Mr. Koehler’s annual base salary, except to the extent the base salaries of all other executive officers of Pacific Ethanol are accordingly reduced, (iii) a relocation of Mr. Koehler’s place of work, or Pacific Ethanol’s principal executive offices if Mr. Koehler’s principal office is at these offices, to a location that increases Mr. Koehler’s daily one-way commute by more than thirty-five miles, or (iv) any material breach by Pacific Ethanol of any material provision of the Amended and Restated Executive Employment Agreement.
The term “cause” is defined in the Amended and Restated Executive Employment Agreement as (i) Mr. Koehler’s indictment or conviction of any felony or of any crime involving dishonesty, (ii) Mr. Koehler’s participation in any fraud or other act of willful misconduct against Pacific Ethanol, (iii) Mr. Koehler’s refusal to comply with any lawful directive of Pacific Ethanol, (iv) Mr. Koehler’s material breach of his fiduciary, statutory, contractual, or common law duties to Pacific Ethanol, or (v) conduct by Mr. Koehler which, in the good faith and reasonable determination of the Board, demonstrates gross unfitness to serve; provided, however, that in the event that any of the foregoing events is reasonably capable of being cured, Pacific Ethanol shall, within twenty days after the discovery of the event, provide written notice to Mr. Koehler describing the nature of the event and Mr. Koehler shall thereafter have ten business days to cure the event.
A “change in control” of Pacific Ethanol is deemed to have occurred if, in a single transaction or series of related transactions (i) any person (as the term is used in Section 13(d) and 14(d) of the Exchange Act), or persons acting as a group, other than a trustee or fiduciary holding securities under an employee benefit program, is or becomes a “beneficial owner” (as defined in Rule 13-3 under the Exchange Act), directly or indirectly of securities of Pacific Ethanol representing a majority of the combined voting power of Pacific Ethanol, (ii) there is a merger, consolidation or other business combination transaction of Pacific Ethanol with or into another corporation, entity or person, other than a transaction in which the holders of at least a majority of the shares of voting capital stock of Pacific Ethanol outstanding immediately prior to the transaction continue to hold (either by the shares remaining outstanding or by their being converted into shares of voting capital stock of the surviving entity) a majority of the total voting power represented by the shares of voting capital stock of Pacific Ethanol (or the surviving entity) outstanding immediately after the transaction, or (iii) all or substantially all of our assets are sold.
| 84 |
Michael Kandris
Our Executive Employment Agreement with Mr. Kandris dated as of January 6, 2013 provides for at-will employment as our Chief Operating Officer. Mr. Kandris initially received a base salary of $246,000 per year, which was increased to $253,380 on March 5, 2014 and further increased to $260,981 on February 15, 2015, and he is eligible to receive an annual discretionary cash bonus of up to 50% of his base salary, to be paid based upon performance criteria set by the Board. For 2013, we paid Mr. Kandris a discretionary cash bonus based on our 2013 performance. For 2014, we paid Mr. Kandris a cash bonus under our annual cash incentive compensation program based on our 2014 performance. All other terms and conditions of Mr. Kandris’ Executive Employment Agreement are substantially the same as those contained in Neil M. Koehler’s Amended and Restated Executive Employment Agreement described above.
Bryon T. McGregor
Our Amended and Restated Executive Employment Agreement with Mr. McGregor effective as of November 25, 2009 provides for at-will employment as our Chief Financial Officer. Mr. McGregor initially received a base salary of $240,000 per year, which was increased to $246,000 effective April 3, 2011, further increased to $253,380 on March 5, 2014 and further increased to $260,981 on February 15, 2015, and is eligible to receive an annual discretionary cash bonus of up to 50% of his base salary, to be paid based upon performance criteria set by the Board. For 2013, we paid Mr. McGregor a discretionary cash bonus based on our 2013 performance. For 2014, we paid Mr. McGregor a cash bonus under our annual cash incentive compensation program based on our 2014 performance. All other terms and conditions of Mr. McGregor’s Amended and Restated Executive Employment Agreement are substantially the same as those contained in Neil M. Koehler’s Amended and Restated Executive Employment Agreement described above.
Christopher W. Wright
Our Amended and Restated Executive Employment Agreement with Mr. Wright dated as of December 11, 2007 provides for at-will employment as our Vice President, General Counsel and Secretary. Mr. Wright initially received a base salary of $225,000 per year, which was increased to $240,000 effective March 1, 2008, further increased to $246,000 effective April 3, 2011, further increased to $253,380 on March 5, 2014 and further increased to $260,981 on February 15, 2015, and is eligible to receive an annual discretionary cash bonus of up to 50% of his base salary, to be paid based upon performance criteria set by the Board. For 2013, we paid Mr. Wright a discretionary cash bonus based on our 2013 performance. For 2014, we paid Mr. Wright a cash bonus under our annual cash incentive compensation program based on our 2014 performance. All other terms and conditions of Mr. Wright’s Amended and Restated Executive Employment Agreement are substantially the same as those contained in Neil M. Koehler’s Amended and Restated Executive Employment Agreement described above.
| 85 |
James R. Sneed
Our Employment Agreement with Mr. Sneed dated as of November 12, 2012 provides for at-will employment as our Vice President of Ethanol Supply and Trading. Mr. Sneed received a signing bonus of $75,000 upon commencement of his employment. Mr. Sneed initially received a base salary of $220,000 per year, which was increased to $226,600 on March 5, 2014 and further increased to $233,398 on February 15, 2015. Beginning January 1, 2013, Mr. Sneed is eligible to participate in a cash bonus program based on the financial results of Kinergy, subject to a guaranteed minimum annual bonus of $30,000 for 2013. For 2013, we paid Mr. Sneed a cash bonus, in accordance with Kinergy’s 2013 bonus program, based on the amount by which Kinergy’s net income exceeded Kinergy’s targeted net income for the year. For 2014, we paid Mr. Sneed a cash bonus under Kinergy’s annual cash incentive compensation program based on our 2014 performance. The severance provisions of Mr. Sneed’s employment agreement entitle him to severance equal to nine months of base salary upon termination by Pacific Ethanol without cause, resignation by the executive for good reason or upon Mr. Sneed’s disability, as those terms are defined above; however, Mr. Sneed is not entitled to the additional severance benefits applicable to our other NEOs.
Clawback Policy
In 2011, our Compensation Committee instituted a “clawback” policy with respect to incentive compensation. Except as otherwise required by applicable law and regulations, the clawback policy applies to any incentive-based compensation awarded or paid after January 1, 2011. The clawback policy mitigates the risks associated with our compensation policies, because certain executive officers will be required to repay compensation in the circumstances identified in the policy. The clawback policy requires recoupment of the incentive based compensation paid or granted to certain executive officers in the event of a material noncompliance with any financial reporting requirements under the federal securities laws (other than to comply with changes in applicable accounting principles).
Our Compensation Committee will reevaluate and, if necessary, revise our clawback policy to comply with the Dodd-Frank Wall Street Reform and Consumer Protection Act once the rules implementing the clawback requirements have been finalized by the Securities and Exchange Commission.
Grants of Plan-Based Awards – 2014
The following table sets forth summary information regarding all grants of plan-based awards made to our NEOs during the year ended December 31, 2014. As of the end of 2014, none of the NEOs held any performance-based equity or non-equity incentive awards.
| Name | Grant Date | All Other Stock Awards: Number of Shares of Stock or Units (#)(1) | Grant Date Fair Value of Stock and Option Awards($)(2) | |||||||
| Neil M. Koehler | June 18, 2014 | 33,944 | $ | 516,288 | ||||||
| Michael D. Kandris | June 18, 2014 | 11,610 | $ | 176,588 | ||||||
| Bryon T. McGregor | June 18, 2014 | 11,610 | $ | 176,588 | ||||||
| Christopher W. Wright | June 18, 2014 | 11,610 | $ | 176,588 | ||||||
| James R. Sneed | June 18, 2014 | 5,091 | $ | 77,434 | ||||||
_______________
| (1) | The stock awards reported in the above table represent shares of stock granted under our 2006 Stock Incentive Plan. One-third of the shares vest on each of April 1, 2015, 2016 and 2017. |
| (2) | The dollar value of grants of common stock shown represents the grant date fair value calculated based on the fair market value of our common stock on the grant date. The actual value that an executive will realize on the award will depend on the price per share of our common stock at the time shares are sold. There is no assurance that the actual value realized by an executive will be at or near the grant date fair value of the shares awarded. |
| 86 |
Outstanding Equity Awards at Fiscal Year-End – 2014
The following table sets forth information about outstanding equity awards held by our NEOs as of December 31, 2014.
| Option Awards | Stock Awards | |||||||||||||||||||||||
| Name | Number of Securities Underlying Unexercised Options (#) Exercisable | Number of Securities Underlying Unexercised Options (#) Unexercisable | Option Exercise Price ($) | Option Expiration Date | Number of Shares or Units of Stock That Have Not Vested (#)(1) | Market
Value of Shares | ||||||||||||||||||
| Neil M. Koehler | 3,750 | (3) | – | $ | 12.90 | 8/1/2021 | 1,191 | (4) | $ | 12,303 | ||||||||||||||
| 37,793 | (5) | 75,586 | (5) | $ | 3.74 | 6/24/2023 | 19,445 | (6) | $ | 200,867 | ||||||||||||||
| 8,334 | (7) | $ | 86,090 | |||||||||||||||||||||
| 37,037 | (8) | $ | 382,592 | |||||||||||||||||||||
| 33,944 | (9) | $ | 350,642 | |||||||||||||||||||||
| Michael D. Kandris | 10,582 | (10) | 21,164 | (10) | $ | 3.74 | 6/24/2023 | 10,371 | (11) | $ | 107,132 | |||||||||||||
| 11,610 | (12) | $ | 119,931 | |||||||||||||||||||||
| Bryon T. McGregor | 1,715 | (13) | – | $ | 12.90 | 8/1/2021 | 334 | (14) | $ | 3,450 | ||||||||||||||
| 10,582 | (10) | 21,164 | (10) | $ | 3.74 | 6/24/2023 | 7,778 | (15) | $ | 80,347 | ||||||||||||||
| 10,371 | (11) | $ | 107,132 | |||||||||||||||||||||
| 11,610 | (12) | $ | 119,931 | |||||||||||||||||||||
| Christopher W. Wright | 1,715 | (13) | – | $ | 12.90 | 8/1/2021 | 334 | (14) | $ | 3,450 | ||||||||||||||
| 10,582 | (10) | 21,164 | (10) | $ | 3.74 | 6/24/2023 | 7,778 | (15) | $ | 80,347 | ||||||||||||||
| 10,371 | (11) | $ | 107,132 | |||||||||||||||||||||
| 11,610 | (12) | $ | 119,931 | |||||||||||||||||||||
| James R. Sneed | 3,401 | (16) | 6,803 | (16) | $ | 3.74 | 6/24/2023 | 7,778 | (17) | $ | 80,347 | |||||||||||||
| 5,091 | (18) | $ | 52,590 | |||||||||||||||||||||
_______________
| (1) | The stock awards reported in the above table represent shares of restricted stock and stock options granted under our 2006 Plan. |
| (2) | Represents the fair market value per share of our common stock on December 31, 2014, which was $10.33, multiplied by the number of shares that had not vested as of that date. |
| (3) | Represents stock options granted on August 1, 2011. The option vested as to 1,250 shares on each of April 1, 2012, 2013 and 2014. |
| (4) | Represents shares granted on August 1, 2011. Mr. Koehler’s grant vests as to 1,191 shares on April 1, 2015. |
| (5) | Represents stock options granted on June 24, 2013. The option vested as to 37,793 shares on April 1, 2014 and vests as to 37,793 shares on each of April 1, 2015 and 2016. |
| (6) | Represents shares granted on March 1, 2013. The grant vests as to 19,445 shares on April 1, 2015. |
| (7) | Represents shares granted on April 12, 2013. The grant vests as to 8,334 shares on April 1, 2015. |
| (8) | Represents shares granted on June 24, 2013. The grant vests as to 18,519 on April 1, 2015 and vests as to 18,518 on April 1, 2016. |
| (9) | Represents shares granted on June 18, 2014. The grant vests as to 11,315 shares on April 1, 2015, vests as to 11,314 shares on April 1, 2016 and vests as to 11,315 shares on April 1, 2017. |
| (10) | Represents stock options granted on June 24, 2013. The option vested as to 10,582 shares on April 1, 2014 and vests as to 10,582 shares on each of April 1, 2015 and 2016. |
| (11) | Represents shares granted on June 24, 2013. The grant vests as to 5,185 shares on April 1, 2015 and 5,186 shares on April 1, 2016. |
| (12) | Represents shares granted on June 18, 2014. The grant vests as to 3,870 shares on each of April 1, 2015, 2016 and 2017. |
| (13) | Represents stock options granted on August 1, 2011. The option vested as to 572 shares on April 1, 2012, vested as to 571 shares on April 1, 2013 and vested as to 572 shares on April 1, 2014. |
| (14) | Represents shares granted on August 1, 2011. The grant vests as to 334 shares on April 1, 2015. |
| (15) | Represents shares granted on March 1, 2013. The grant vests as to 7,778 shares on April 1, 2015. |
| (16) | Represents stock options granted on June 24, 2013. The option vested as to 3,401 shares on April 1, 2014, vests as to 3,402 shares on April 1, 2015 and vests as to 3,401 shares on April 1, 2016. |
| (17) | Represents shares granted on June 24, 2013. The grant vests as to 3,889 shares on each of April 1, 2015 and 2016. |
| (18) | Represents shares granted on June 18, 2014. The grant vests as to 1,697 shares on each of April 1, 2015, 2016 and 2017. |
| 87 |
Option Exercises and Stock Vested – 2014
The following table summarizes the vesting of stock awards for each of our NEOs for the year ended December 31, 2014:
Stock Awards | ||||||||
| Name | Number of Shares Acquired on Vesting (#) | Value Realized on Vesting ($)(1) | ||||||
| Neil M. Koehler | 48,915 | $ | 868,934 | |||||
| Michael D. Kandris | 5,185 | $ | 92,812 | |||||
| Bryon T. McGregor | 13,696 | $ | 243,298 | |||||
| Christopher W. Wright | 13,696 | $ | 243,298 | |||||
| James R. Sneed | 3,889 | $ | 69,613 | |||||
_______________
| (1) | Represents the closing price of a share of our common stock on the date of vesting multiplied by the number of shares that vested on such date, including any shares that were withheld by us to satisfy minimum employment withholding taxes. |
Severance and Change in Control Arrangements with Named Executive Officers
Executive Employment Agreements. We have entered into agreements with our NEOs that provide certain benefits upon the termination of their employment under certain prescribed circumstances. Those agreements are described under “Executive Employment Agreements” above.
2006 Stock Incentive Plan. Under our 2006 Stock Incentive Plan, if a change in control occurs, each outstanding equity award under the discretionary grant program will automatically accelerate in full, unless (i) that award is assumed by the successor corporation or otherwise continued in effect, (ii) the award is replaced with a cash retention program that preserves the spread existing on the unvested shares subject to that equity award (the excess of the fair market value of those shares over the exercise or base price in effect for the shares) and provides for subsequent payout of that spread in accordance with the same vesting schedule in effect for those shares, or (iii) the acceleration of the award is subject to other limitations imposed by the plan administrator. In addition, all unvested shares outstanding under the discretionary grant and stock issuance programs will immediately vest upon the change in control, except to the extent our repurchase rights with respect to those shares are to be assigned to the successor corporation or otherwise continued in effect or accelerated vesting is precluded by other limitations imposed by the plan administrator. Each outstanding equity award under the stock issuance program will vest as to the number of shares of common stock subject to that award immediately prior to the change in control, unless that equity award is assumed by the successor corporation or otherwise continued in effect or replaced with a cash retention program similar to the program described in clause (ii) above or unless vesting is precluded by its terms. Immediately following a change in control, all outstanding awards under the discretionary grant program will terminate and cease to be outstanding except to the extent assumed by the successor corporation or its parent or otherwise expressly continued in full force and effect pursuant to the terms of the change in control transaction.
The plan administrator will have the discretion to structure one or more equity awards under the discretionary grant and stock issuance programs so that those equity awards will vest in full either immediately upon a change in control or in the event the individual’s service with us or the successor entity is terminated (actually or constructively) within a designated period following a change in control transaction, whether or not those equity awards are to be assumed or otherwise continued in effect or replaced with a cash retention program.
The definition of “change in control” under our 2006 Stock Incentive Plan is substantially the same as provided under “Executive Employment Agreements” above.
| 88 |
Calculation of Potential Payments upon Termination or Change in Control – 2014
In accordance with the rules of the Securities and Exchange Commission, the following table presents our estimate of the benefits payable to our NEOs under their executive employment agreements and our 2006 Stock Incentive Plan assuming that for each of the NEOs (i) a “change in control” occurred on December 31, 2014, the last business day of 2014, and (a) there was a termination by the executive “for good reason,” or by us without “cause” within three months before or twelve months after the change in control, or (b) none of the executives’ equity awards were assumed by the successor corporation or replaced with a cash retention program, (ii) a qualifying termination occurred on December 31, 2014, which is a termination by the executive “for good reason,” by us without “cause” or upon the executive’s disability, or (iii) a non-qualifying termination occurred on December 31, 2014, which is a voluntary termination by the executive other than “for good reason” or by us for “cause.” See “Executive Employment Agreements” above for the definitions of “for good reason,” “cause” and “change in control.”
| Name | Trigger | Salary and Bonus(1) | Continuation of Benefits(2) | Value of Stock Acceleration(3) |
| |||||||||||||
| Neil M. Koehler | Change in Control | $ | 593,859 | $ | 22,198 | $ | 1,032,494 | $ | 1,648,551 | |||||||||
| Qualifying Termination | $ | 395,906 | $ | 14,799 | $ | 258,126 | $ | 668,831 | ||||||||||
| Non-Qualifying Termination | $ | – | $ | – | $ | – | $ | – | ||||||||||
| Michael D. Kandris | Change in Control | $ | 380,070 | $ | 16,105 | $ | 227,064 | $ | 623,239 | |||||||||
| Qualifying Termination | $ | 253,380 | $ | 10,736 | $ | 56,774 | $ | 320,890 | ||||||||||
| Non-Qualifying Termination | $ | – | $ | – | $ | – | $ | – | ||||||||||
| Bryon T. McGregor | Change in Control | $ | 380,070 | $ | 22,198 | $ | 310,861 | $ | 713,129 | |||||||||
| Qualifying Termination | $ | 253,380 | $ | 14,799 | $ | 77,733 | $ | 345,912 | ||||||||||
| Non-Qualifying Termination | $ | – | $ | – | $ | – | $ | – | ||||||||||
| Christopher W. Wright | Change in Control | $ | 380,070 | $ | 7,942 | $ | 310,861 | $ | 698,873 | |||||||||
| Qualifying Termination | $ | 253,380 | $ | 5,294 | $ | 77,733 | $ | 336,407 | ||||||||||
| Non-Qualifying Termination | $ | – | $ | – | $ | – | $ | – | ||||||||||
| James R. Sneed | Change in Control | $ | 169,950 | $ | – | $ | – | $ | 169,950 | |||||||||
| Qualifying Termination | $ | 169,950 | $ | – | $ | – | $ | 169,950 | ||||||||||
| Non-Qualifying Termination | $ | – | $ | – | $ | – | $ | – | ||||||||||
_______________
| (1) | Amount represents eighteen months additional salary after the date of termination in the event of a change in control and twelve months additional salary after the date of termination in the event of a qualifying termination, in each case based on the executive’s salary as of December 31, 2014; provided, that James R. Sneed is entitled to nine months of additional salary after the date of termination in the event of a change in control or a qualifying termination, in each case based on the executive’s salary as of December 31, 2014. |
| (2) | For those NEOs reported as eligible for benefits, the amount represents the aggregate value of the continuation of certain employee health benefits for up to eighteen months after the date of termination in the event of a change in control and for up to twelve months after the date of termination in the event of a qualifying termination. |
| (3) | For those NEOs reported as eligible for acceleration of vesting benefits, the amount represents the aggregate value of the accelerated vesting of 100% of all of the executive’s unvested restricted stock grants in the event of a change in control and 25% of all of the executive’s unvested restricted stock grants in the event of a qualifying termination. The amounts shown as the value of the accelerated restricted stock grants are based solely on the intrinsic value of the restricted stock grants as of December 31, 2014, which was calculated by multiplying (i) the fair market value of our common stock on December 31, 2014, which was $10.33 per share, by (ii) the assumed number of shares vesting on an accelerated basis on December 31, 2014. |
| (4) | Excludes the value to the executive of the continuing right to indemnification and continuing coverage under our directors’ and officers’ liability insurance, if applicable. |
| 89 |
Compensation Committee Interlocks and Insider Participation
Our Compensation Committee consists of Larry D. Layne, John L. Price, Douglas L. Kieta and Terry L. Stone. None of these individuals were officers or employees of Pacific Ethanol at any time during 2014 or at any other time. During 2014, none of our executive officers served as a member of the board of directors or compensation committee of any other entity whose executive officer(s) served on our Board or Compensation Committee.
Compensation of Directors
We use a combination of cash and equity-based incentive compensation to attract and retain qualified candidates to serve on our Board. In setting the compensation of directors, we consider the significant amount of time that Board members spend in fulfilling their duties to Pacific Ethanol as well as the experience level we require to serve on our Board. The Board, through its Compensation Committee, annually reviews the compensation and compensation policies for Board members. In recommending director compensation, the Compensation Committee is guided by the following three goals:
| · | compensation should pay directors fairly for work required in a company of our size and scope; |
| · | compensation should align directors’ interests with the long-term interests of our stockholders; and |
| · | the structure of the compensation should be clearly disclosed to our stockholders. |
In making compensation decisions for 2014 as to our directors, our Compensation Committee compared our cash and equity compensation payable to directors against market data obtained by Hay Group in 2014. The Hay Group data included a survey of 1,400 companies across 24 industries, with revenues between $500 million and $1 billion. For 2014, our Compensation Committee set compensation for our directors at approximately the median of compensation paid to directors of the companies contained in the Hay Group data.
Cash Compensation
Effective April 10, 2014, our annual cash compensation plan for directors included the following changes. The annual cash compensation provided to the Chairman of our Board increased from $80,000 to $97,500. The annual cash compensation provided to the Chairman of our Audit Committee, the Chairman of our Strategic Transactions Committee and the Chairman of our Compensation Committee increased from $42,000 to $65,000. The annual cash compensation provided to the Chairman of our Nominating and Corporate Governance Committee and lead independent director increased from $42,000 to $77,000. These amounts were paid in advance in bi-weekly installments. In addition, directors were reimbursed for specified reasonable and documented expenses in connection with attendance at meetings of our Board and its committees. Employee directors do not receive director compensation in connection with their service as directors.
| 90 |
Equity Compensation
Our Compensation Committee or our full Board typically grants equity compensation to our newly elected or reelected directors which normally vests as to 100% of the grants no later than one year after the date of grant. Vesting is normally subject to continued service on our Board during the full year.
In determining the amount of equity compensation for 2014, the Compensation Committee determined the value of total compensation, approximately targeting the median of compensation paid to directors of the companies comprising the market data provided to us by Hay Group in 2014. The Compensation Committee then determined the cash component based on this market data. The balance of the total compensation target was then allocated to equity awards, and the number of shares to be granted to our directors was based on the estimated value of the underlying shares on the expected grant date.
In addition, our Compensation Committee may grant, and has from time to time granted, additional equity compensation to directors at its discretion.
Compensation of Employee Directors
Messrs. Koehler and Kandris were compensated as a full-time employees and officers and therefore received no additional compensation for service as Board members during 2014. Information regarding the compensation awarded to Messrs. Koehler and Kandris is included in “Executive Compensation and Related Information—Summary Compensation Table” above.
Director Compensation Table – 2014
The following table summarizes the compensation of our non-employee directors for the year ended December 31, 2014:
| Name | Fees Earned or Paid in Cash ($)(1) | StockAwards ($) | All
other | Total ($) | ||||||||||||
| William L. Jones | $ | 93,462 | $ | 100,675 | (3) | $ | – | $ | 194,137 | |||||||
| Terry L. Stone | $ | 59,692 | $ | 67,107 | (4) | $ | – | $ | 126,799 | |||||||
| John L. Prince | $ | 70,308 | $ | 67,107 | (5) | $ | – | $ | 137,415 | |||||||
| Douglas L. Kieta | $ | 58,308 | $ | 67,107 | (6) | $ | – | $ | 125,415 | |||||||
| Larry D. Layne | $ | 58,308 | $ | 67,107 | (7) | $ | – | $ | 125,415 | |||||||
_______________
| (1) | For a description of annual director fees and fees for chair positions, see the disclosure above under “Compensation of Directors—Cash Compensation.” |
| (2) | The value of perquisites and other personal benefits was less than $10,000 in aggregate for each director. |
| (3) | At December 31, 2014, Mr. Jones held 24,893 vested shares from stock awards and also held options to purchase an aggregate of 477 shares of common stock. Mr. Jones was granted 6,619 shares of our common stock on June 18, 2014 having an aggregate grant date fair value of $100,675, calculated based on the fair market value of our common stock on the applicable grant date. The shares vest on the earlier of our next annual meeting or July 1, 2015. |
| (4) | At December 31, 2014, Mr. Stone held 11,646 vested shares from stock awards and also held options to purchase an aggregate of 143 shares of common stock. Mr. Stone was granted 4,412 shares of our common stock on June 18, 2014 having an aggregate grant date fair value of $67,107, calculated based on the fair market value of our common stock on the applicable grant date. The shares vest on the earlier of our next annual meeting or July 1, 2015. |
| (5) | At December 31, 2014, Mr. Prince held 11,931 vested shares from stock awards and also held options to purchase an aggregate of 143 shares of common stock. Mr. Prince was granted 4,412 shares of our common stock on June 18, 2014 having an aggregate grant date fair value of $67,107, calculated based on the fair market value of our common stock on the applicable grant date. The shares vest on the earlier of our next annual meeting or July 1, 2015. |
| (6) | At December 31, 2014, Mr. Kieta held 23,290 vested shares from stock awards. Mr. Kieta was granted 4,412 shares of our common stock on June 18, 2014 having an aggregate grant date fair value of $67,107, calculated based on the fair market value of our common stock on the applicable grant date. The shares vest on the earlier of our next annual meeting or July 1, 2015. |
| (7) | At December 31, 2014, Mr. Layne held 1,970 vested shares from stock awards. Mr. Layne was granted 4,412 shares of our common stock on June 18, 2014 having an aggregate grant date fair value of $67,107, calculated based on the fair market value of our common stock on the applicable grant date. The shares vest on the earlier of our next annual meeting or July 1, 2015. |
| 91 |
Indemnification of Directors and Officers
Section 145 of the Delaware General Corporation Law permits a corporation to indemnify its directors and officers against expenses, judgments, fines and amounts paid in settlement actually and reasonably incurred in connection with a pending or completed action, suit or proceeding if the officer or director acted in good faith and in a manner the officer or director reasonably believed to be in the best interests of the corporation.
Our certificate of incorporation provides that, except in certain specified instances, our directors shall not be personally liable to us or our stockholders for monetary damages for breach of their fiduciary duty as directors, except liability for the following:
| · | any breach of their duty of loyalty to Pacific Ethanol or our stockholders; |
| · | acts or omissions not in good faith or which involve intentional misconduct or a knowing violation of law; |
| · | unlawful payments of dividends or unlawful stock repurchases or redemptions as provided in Section 174 of the Delaware General Corporation Law; and |
| · | any transaction from which the director derived an improper personal benefit. |
In addition, our certificate of incorporation and bylaws obligate us to indemnify our directors and officers against expenses and other amounts reasonably incurred in connection with any proceeding arising from the fact that such person is or was an agent of ours. Our bylaws also authorize us to purchase and maintain insurance on behalf of any of our directors or officers against any liability asserted against that person in that capacity, whether or not we would have the power to indemnify that person under the provisions of the Delaware General Corporation Law. We have entered and expect to continue to enter into agreements to indemnify our directors and officers as determined by our Board. These agreements provide for indemnification of related expenses including attorneys’ fees, judgments, fines and settlement amounts incurred by any of these individuals in any action or proceeding. We believe that these bylaw provisions and indemnification agreements are necessary to attract and retain qualified persons as directors and officers. We also maintain directors’ and officers’ liability insurance.
The limitation of liability and indemnification provisions in our certificate of incorporation and bylaws may discourage stockholders from bringing a lawsuit against our directors for breach of their fiduciary duty. They may also reduce the likelihood of derivative litigation against our directors and officers, even though an action, if successful, might benefit us and other stockholders. Furthermore, a stockholder’s investment may be adversely affected to the extent that we pay the costs of settlement and damage awards against directors and officers as required by these indemnification provisions.
Insofar as indemnification for liabilities arising under the Securities Act may be permitted to our directors, officers and controlling persons under the foregoing provisions of our certificate of incorporation or bylaws, or otherwise, we have been informed that in the opinion of the Securities and Exchange Commission, this indemnification is against public policy as expressed in the Securities Act and is therefore unenforceable.
| Item 12. | Security Ownership of Certain Beneficial Owners and Management and Related Stockholder Matters. |
Security Ownership of Certain Beneficial Owners and Management
The following table sets forth information with respect to the beneficial ownership of our voting securities as of March 13, 2015, the date of the table, by:
| · | each of our executive officers; |
| · | each of our directors; |
| · | all of our executive officers and directors as a group; and |
| · | each person known by us to beneficially own more than 5% of the outstanding shares of any class of our capital stock. |
| 92 |
Beneficial ownership is determined in accordance with the rules of the Securities and Exchange Commission, and includes voting or investment power with respect to the securities. To our knowledge, except as indicated by footnote, and subject to community property laws where applicable, the persons named in the table below have sole voting and investment power with respect to all shares of common stock shown as beneficially owned by them. Shares of common stock underlying derivative securities, if any, that currently are exercisable or convertible or are scheduled to become exercisable or convertible for or into shares of common stock within 60 days after the date of the table are deemed to be outstanding in calculating the percentage ownership of each listed person or group but are not deemed to be outstanding as to any other person or group. Except as indicated by footnote, percentage of beneficial ownership is based on 25,511,200 shares of common stock and 926,942 shares of Series B Preferred Stock outstanding as of the date of the table.
Name and Address of Beneficial Owner(1) | Title of Class | Amount and Nature of Beneficial Ownership | Percent of Class | |||||||
| William L. Jones | Common | 40,950 | (2) | * | ||||||
| Series B Preferred | 12,820 | 1.38% | ||||||||
| Neil M. Koehler | Common | 586,408 | (3) | 2.28% | ||||||
| Series B Preferred | 256,410 | 27.66% | ||||||||
| Bryon T. McGregor | Common | 76,006 | (4) | * | ||||||
| Christopher W. Wright | Common | 73,336 | (5) | * | ||||||
| Terry L. Stone | Common | 17,888 | (6) | * | ||||||
| John L. Prince | Common | 17,887 | (7) | * | ||||||
| Douglas L. Kieta | Common | 29,719 | * | |||||||
| Larry D. Layne | Common | 6,382 | * | |||||||
| Michael D. Kandris | Common | 59,089 | (8) | * | ||||||
| Paul P. Koehler | Common | 51,144 | (9) | * | ||||||
| Series B Preferred | 12,820 | 1.38% | ||||||||
| James R. Sneed | Common | 22,102 | (10) | * | ||||||
| Frank P. Greinke | Common | 58,319 | (11) | * | ||||||
| Series B Preferred | 85,180 | 9.19% | ||||||||
| Lyles United, LLC | Common | 380,413 | (12) | 1.47% | ||||||
| Series B Preferred | 512,820 | 55.32% | ||||||||
| Black Rock, Inc. | Common | 1,476,583 | (13) | 5.79% | ||||||
| Vertex One Asset Management, Inc. | Common | 1,418,380 | (14) | 5.56% | ||||||
| Gregg L. Engles | Common | 1,321,285 | (15) | 5.18% | ||||||
| All executive officers and directors as a group (11 persons) | Common | 980,911 | (16) | 3.79% | ||||||
| _______________ | Series B Preferred | 282,050 | 30.43% | |||||||
| * | Less than 1.00% |
| (1) | Messrs. Jones, Koehler, Stone, Prince, Kieta, Layne and Kandris are directors of Pacific Ethanol. Messrs. N. Koehler, McGregor, Kandris, P. Koehler, Wright and Sneed are executive officers of Pacific Ethanol. The address of each of these persons is c/o Pacific Ethanol, Inc., 400 Capitol Mall, Suite 2060, Sacramento, California 95814. |
| (2) | Amount represents 31,512 shares of common stock held by William L. Jones and Maurine Jones, husband and wife, as community property, 477 shares of common stock underlying options issued to Mr. Jones, 184 shares of common stock underlying a warrant issued to Mr. Jones and 8,777 shares of common stock underlying our Series B Preferred Stock held by Mr. Jones. |
| (3) | Amount represents 328,611 shares of common stock held directly, 3,663 shares of common stock underlying a warrant, 175,554 shares of common stock underlying our Series B Preferred Stock and 78,580 shares of common stock underlying options. |
| (4) | Includes 22,667 shares of common stock underlying options. |
| (5) | Includes 22,667 shares of common stock underlying options. |
| (6) | Includes 143 shares of common stock underlying options. |
| (7) | Includes 143 shares of common stock underlying options. |
| (8) | Includes 20,952 shares of common stock underlying options. |
| (9) | Amount represents 35,326 shares of common stock held directly, 184 shares of common stock underlying a warrant, 8,777 shares of common stock underlying our Series B Preferred Stock and 6,857 shares of common stock underlying options. |
| (10) | Includes 6,803 shares of common stock underlying options. |
| (11) | Amount represents shares of common stock underlying our Series B Preferred Stock. The shares are beneficially owned by Frank P. Greinke, as trustee under the Greinke Personal Living Trust Dated April 20, 1999. The address of Frank P. Greinke is P.O. Box 4159, 1800 W. Katella, Suite 400, Orange, California 92863. |
| (12) | Amount represents 29,305 shares of common stock underlying a warrant and 351,108 shares of common stock underlying our Series B Preferred Stock. In addition, Lyles Diversified, Inc. holds 5,333 shares of common stock and The Lyles Foundation holds 3,488 shares of common stock. The address of Lyles United, LLC is P.O. Box 4376, Fresno, California 93744-4376. |
| 93 |
| (13) | The information with respect to the holdings of BlackRock, Inc. is based solely on the Schedule 13G filed with the Securities and Exchange Commission on February 2, 2015 by BlackRock, Inc. as the reporting person which indicates that BlackRock, Inc. is acting as a parent holding company or control person for the following subsidiaries: BlackRock Advisors, LLC; BlackRock Asset Management Canada Limited; BlackRock Fund Advisors; BlackRock Institutional Trust Company, N.A.; and BlackRock Investment Management, LLC. As reported in the Schedule 13G, BlackRock, Inc. holds sole voting power over 1,439,036 shares and holds sole dispositive power and beneficial ownership of 1,476,583 shares. The address for BlackRock, Inc. is 55 East 52nd Street, New York, New York, 10022. |
| (14) | The information with respect to the holdings of Vertex One Asset Management, Inc. is based solely on the Schedule 13G filed with the Securities and Exchange Commission on February 4, 2015 by Vertex One Asset Management, Inc., John Thiessen and Vertex Fund as the reporting persons. As reported in the Schedule 13G, an aggregate of 1,418,380 shares beneficially owned by Vertex One Asset Management, Inc. and Mr. Thiessen are held by persons in respect of which Vertex One Asset Management, Inc. acts as fund manager. Mr. Thiessen is the principal of Vertex One Asset Management, Inc. with discretionary control over the assets of such persons. Each of Vertex One Asset Management, Inc. and Mr. Thiessen are reported as holding shared voting and dispositive power over 1,418,380 shares. As further reported in the Schedule 13G, Vertex Fund holds shared voting and dispositive power over 1,072,232 shares, all of which are beneficially owned by Vertex Fund. According to the Schedule 13G, the reporting persons made the single, joint filing because they may be deemed to constitute a “group” within the meaning of Section 13(d)(3) of the Exchange Act, but each reporting person disclaims the existence of a “group” and, except as noted, disclaims beneficial ownership of all shares other than any shares reported as being directly owned by it or him, as the case may be. The address for each of Vertex One Asset Management, Inc., John Thiessen and Vertex Fund is c/o Vertex One Asset Management, Inc., 1177 W. Hastings St. #1920, Vancouver, BC V6E 2K3, Canada. |
| (15) | The information with respect to the holdings of Gregg L. Engles is based solely on the Schedule 13G/A filed with the Securities and Exchange Commission on February 2, 2015 by Gregg L. Engles as the reporting person. As reported in the Schedule 13G/A, Mr. Engles holds sole voting and dispositive power over 1,318,500 shares and holds shared voting and dispositive power over an additional 2,785 shares owned by his spouse and as to which Mr. Engles disclaims beneficial ownership. The address for Gregg L. Engles is 2750 Burbank Street, Dallas, Texas 75235. |
| (16) | Amount represents 624,483 shares of common stock held directly, 159,289 shares of common stock underlying options, 4,031 shares of common stock underlying warrants and 193,108 shares of common stock underlying our Series B Preferred Stock. |
Equity Compensation Plan Information
The following table provides information about our common stock that may be issued upon the exercise of options, warrants and rights under all of our existing equity compensation plans as of December 31, 2014.
| Plan Category | Number of Securities to be Issued Upon Exercise of Outstanding Options, Warrants and Rights | Weighted-Average Exercise Price of Outstanding Options, Warrants and Rights | Number of Securities Remaining Available for Future Issuance Under Equity Compensation Plans(1) | |||||||||
| Equity Compensation Plans Approved by Security Holders: | ||||||||||||
| 2004 Plan(1) | 763 | $ | 867.23 | – | ||||||||
| 2006 Plan | 240,713 | $ | 4.18 | 739,430 | ||||||||
________________
| (1) | Our 2004 Stock Option Plan was terminated effective September 7, 2006, except to the extent of then-outstanding options. |
| 94 |
| Item 13. | Certain Relationships and Related Transactions, and Director Independence. |
Director Independence
Our corporate governance guidelines provide that a majority of the Board and all members of our Audit, Compensation and Nominating and Corporate Governance Committees shall be independent. On an annual basis, each director and executive officer is obligated to complete a Director and Officer Questionnaire that requires disclosure of any transactions with Pacific Ethanol in which a director or executive officer, or any member of his or her immediate family, have a direct or indirect material interest. Following completion of these questionnaires, the Board, with the assistance of the Nominating and Corporate Governance Committee, makes an annual determination as to the independence of each director using the current standards for “independence” established by the Securities and Exchange Commission and NASDAQ, additional criteria contained in our corporate governance guidelines and consideration of any other material relationship a director may have with Pacific Ethanol.
The Board has determined that all of its directors are independent under these standards, except for Neil M. Koehler, who serves as our Chief Executive Officer and President, and Michael D. Kandris, who serves as our Chief Operating Officer. Messrs. Koehler and Kandris are deemed not to be independent due to their employment relationships with Pacific Ethanol, Inc.
Policies and Procedures for Approval of Related Party Transactions
Our Board has the responsibility to review and discuss with management and approve, and has adopted written policies and procedures relating to approval or ratification of, interested transactions with related parties. During this process, the material facts as to the related party’s interest in a transaction are disclosed to all Board members or the Audit Committee. Under the policies and procedures, the Board, through the Audit Committee, is to review each interested transaction with a related party that requires approval and either approve or disapprove of the entry into the interested transaction. An interested transaction is any transaction in which we are a participant and in which any related party has or will have a direct or indirect interest. Transactions that are in the ordinary course of business and would not require either disclosure required by Item 404(a) of Regulation S-K under the Securities Act or approval of the Board or an independent committee of the Board as required by applicable NASDAQ rules would not be deemed interested transactions. No director may participate in any approval of an interested transaction with respect to which he or she is a related party. Our Board intends to approve only those related party transactions that are in the best interests of Pacific Ethanol and our stockholders.
Other than as described below or elsewhere in this report, since January 1, 2013, there has not been a transaction or series of related transactions to which Pacific Ethanol was or is a party involving an amount in excess of $120,000 and in which any director, executive officer, holder of more than 5% of any class of our voting securities, or any member of the immediate family of any of the foregoing persons, had or will have a direct or indirect material interest. All of the below transactions were separately approved by our Board.
Certain Relationships and Related Transactions
Miscellaneous
We are or have been a party to employment and compensation arrangements with related parties, as more particularly described above in “Executive Compensation.” In addition, we have entered into an indemnification agreement with each of our directors and executive officers. The indemnification agreements and our certificate of incorporation and bylaws require us to indemnify our directors and officers to the fullest extent permitted by Delaware law.
| 95 |
Neil M. Koehler
Series B Preferred Stock
On May 20, 2008, we sold to Neil M. Koehler, who is our President and Chief Executive Officer and one of our directors, 256,410 shares of our Series B Preferred Stock, all of which were initially convertible into an aggregate of 7,326 shares of our common stock based on an initial preferred-to-common stock conversion ratio of approximately 1-for-0.03, and warrants to purchase an aggregate of 3,663 shares of our common stock at a split-adjusted exercise price of $735 per share, for an aggregate purchase price of $5,000,000. As a result of various anti-dilution adjustments, the conversion ratio of the Series B Preferred Stock has increased to approximately 1-for-0.68. For each of the years ended December 31, 2014 and 2013, we accrued and paid cash dividends in the amount of $350,000 in respect of shares of Series B Preferred Stock held by Mr. Koehler.
On the following dates we entered into agreements with Mr. Koehler under which the following amounts of accrued and unpaid dividends in respect of shares of Series B Preferred Stock held by Mr. Koehler were to be paid in shares of our common stock at the following prices per share. We made such payments by issuing the following number of shares of common stock to Mr. Koehler on the dates indicated.
| Agreement Date | Accrued Dividends | Price Per Share | Shares Issued | Issuance Date | ||||||||||
| August 21, 2012 | $ | 105,000 | $ | 4.65 | 22,581 | August 24, 2012 | ||||||||
| December 26, 2012 | $ | 105,000 | $ | 5.06 | 20,753 | December 31, 2012 | ||||||||
| March 27, 2013 | $ | 105,000 | $ | 5.25 | 20,000 | March 28, 2013 | ||||||||
| July 26, 2013 | $ | 105,000 | $ | 4.19 | 25,082 | July 31, 2013 | ||||||||
| September 13, 2013 | $ | 105,000 | $ | 3.72 | 28,247 | September 17, 2013 | ||||||||
| May 23, 2014 | $ | 210,000 | $ | 12.16 | 17,270 | May 28, 2014 | ||||||||
In November and December 2014, we paid cash in the aggregate amount of $314,999 to Mr. Koehler representing all accrued and unpaid dividends in respect of shares of Series B Preferred Stock held by Mr. Koehler. As of December 31, 2014, there were no accrued and unpaid dividends in respect of shares of Series B Preferred Stock held by Mr. Koehler.
Loan Transaction
On March 30, 2009, we entered into an unsecured promissory note in favor of Mr. Koehler. The promissory note was for the principal amount of $1,000,000. Interest on the unpaid principal amount of the promissory note accrues at a rate per annum of 8.00%. On March 29, 2010, we entered into an amendment to the promissory note to extend its maturity date to January 5, 2011. On October 29, 2010, we paid all accrued interest under the promissory note, totaling $126,500. On November 5, 2010, we entered into an amendment to the promissory note extending its maturity date to March 31, 2012. On December 31, 2010, we paid all accrued interest under the promissory note, totaling $13,774. On November 30, 2011, we made a principal payment of $250,000, resulting in an unpaid principal balance of $750,000. On March 7, 2012, we entered into an amendment to the promissory note further extending its maturity date to March 31, 2013. On February 7, 2013, we entered into an amendment to the promissory note further extending its maturity date to March 31, 2014. For the years ended December 31, 2014 and 2013, we paid all accrued interest under the promissory note, totaling $14,795 and $60,000, respectively. On March 31, 2014, we paid in cash the outstanding balance of the promissory note.
| 96 |
Paul P. Koehler
Paul P. Koehler, a brother of Neil M. Koehler, who is our President and Chief Executive Officer and one of our directors, is employed by us as Vice President of Corporate Development at an annual salary of $233,398.
Series B Preferred Stock
On May 20, 2008, we sold to Mr. Koehler 12,820 shares of our Series B Preferred Stock, all of which were initially convertible into an aggregate of 366 shares of our common stock based on an initial preferred-to-common conversion ratio of approximately 1-for-0.03, and warrants to purchase an aggregate of 184 shares of our common stock at a split-adjusted exercise price of $735 per share, for an aggregate purchase price of $250,000. As a result of various anti-dilution adjustments, the conversion ratio of the Series B Preferred Stock has increased to approximately 1-for-0.68. For each of the years ended December 31, 2014 and 2013, we accrued and paid cash dividends in the amount of $17,500 in respect of shares of Series B Preferred Stock held by Mr. Koehler.
On the following dates we entered into agreements with Mr. Koehler under which the following amounts of accrued and unpaid dividends in respect of shares of Series B Preferred Stock held by Mr. Koehler were to be paid in shares of our common stock at the following prices per share. We made such payments by issuing the following number of shares of common stock to Mr. Koehler on the dates indicated.
| Agreement Date | Accrued Dividends | Price Per Share | Shares Issued | Issuance Date | ||||||||||
| August 21, 2012 | $ | 5,250 | $ | 4.65 | 1,129 | August 24, 2012 | ||||||||
| December 26, 2012 | $ | 5,250 | $ | 5.10 | 1,038 | December 31, 2012 | ||||||||
| March 27, 2013 | $ | 5,250 | $ | 5.25 | 1,000 | March 28, 2013 | ||||||||
| July 26, 2013 | $ | 5,250 | $ | 4.19 | 1,255 | July 31, 2013 | ||||||||
| September 13, 2013 | $ | 5,250 | $ | 3.72 | 1,413 | September 17, 2013 | ||||||||
| May 23, 2014 | $ | 10,500 | $ | 12.16 | 864 | May 28, 2014 | ||||||||
In November and December 2014, we paid cash in the aggregate amount of $15,748 to Mr. Koehler representing all accrued and unpaid dividends in respect of shares of Series B Preferred Stock held by Mr. Koehler. As of December 31, 2014, there were no accrued and unpaid dividends in respect of shares of Series B Preferred Stock held by Mr. Koehler.
Restricted Stock Grants
On January 4, 2013, we granted 12,500 shares of our restricted common stock to Mr. Koehler in consideration of services to be provided. The value of the common stock was determined to be $67,406.
On June 24, 2013, we granted 11,667 shares of restricted common stock to Mr. Koehler in consideration of services to be provided. The value of the common stock was determined to be $43,635. On June 24, 2013, we also granted to Mr. Koehler an option to purchase up to 10,204 shares of our common stock at an exercise price of $3.74 per share as incentive compensation. The option vested as to approximately one-third of the shares on April 1, 2014 and vests as to approximately one-third of the shares on each of April 1, 2015 and 2016.
On June 18, 2014, we granted 5,091 shares of our restricted common stock to Mr. Koehler in consideration of services to be provided. The value of the common stock was determined to be $77,434. One-third of the shares vests on each of April 1, 2015, 2016 and 2017.
| 97 |
Annual Cash Incentive Compensation
For 2013, we paid Mr. Koehler a discretionary cash bonus of $52,800 based on our 2013 performance.
For 2014, we paid Mr. Koehler annual performance-based cash incentive compensation of $103,670 based on our 2014 performance.
Thomas D. Koehler
Series B Preferred Stock
On May 20, 2008, we sold to Thomas D. Koehler, a brother of Neil M. Koehler, who is our President and Chief Executive Officer and one of our directors, 12,820 shares of our Series B Preferred Stock, all of which were initially convertible into an aggregate of 366 shares of our common stock based on an initial preferred-to-common conversion ratio of approximately 1-for-0.03, and warrants to purchase an aggregate of 184 shares of our common stock at a split-adjusted exercise price of $735 per share, for an aggregate purchase price of $250,000. As a result of various anti-dilution adjustments, the conversion ratio of the Series B Preferred Stock has increased to approximately 1-for-0.68. For each of the years ended December 31, 2014 and 2013, we accrued and paid cash dividends in the amount of $17,500 in respect of shares of Series B Preferred Stock held by Mr. Koehler.
On the following dates we entered into agreements with Mr. Koehler under which the following amounts of accrued and unpaid dividends in respect of shares of Series B Preferred Stock held by Mr. Koehler were to be paid in shares of our common stock at the following prices per share. We made such payments by issuing the following number of shares of common stock to Mr. Koehler on the dates indicated.
| Agreement Date | Accrued Dividends | Price Per Share | Shares Issued | Issuance Date | ||||||||||
| August 21, 2012 | $ | 5,250 | $ | 4.65 | 1,129 | August 24, 2012 | ||||||||
| December 26, 2012 | $ | 5,250 | $ | 5.10 | 1,038 | December 31, 2012 | ||||||||
| March 27, 2013 | $ | 5,250 | $ | 5.25 | 1,000 | March 28, 2013 | ||||||||
| July 26, 2013 | $ | 5,250 | $ | 4.19 | 1,255 | July 31, 2013 | ||||||||
| September 13, 2013 | $ | 5,250 | $ | 3.72 | 1,413 | September 17, 2013 | ||||||||
| May 23, 2014 | $ | 10,500 | $ | 12.16 | 864 | May 28, 2014 | ||||||||
In November and December 2014, we paid cash in the aggregate amount of $15,748 to Mr. Koehler representing all accrued and unpaid dividends in respect of shares of Series B Preferred Stock held by Mr. Koehler. As of December 31, 2014, there were no accrued and unpaid dividends in respect of shares of Series B Preferred Stock held by Mr. Koehler.
Independent Contractor Services Agreement
On April 1, 2008, we entered into an Independent Contractor Services Agreement with Mr. Koehler for the provision of strategic consulting services, including in connection with promoting Pacific Ethanol, and ethanol as a fuel additive and transportation fuel, with governmental agencies. Mr. Koehler was compensated at a rate of $5,000 per month under this arrangement from April 1, 2008 through September 30, 2010. Effective October 1, 2010, Mr. Koehler’s compensation was increased to $7,500 per month.
| 98 |
William L. Jones
Series B Preferred Stock
On May 20, 2008, we sold to William L. Jones, who is our Chairman of the Board and one of our directors, 12,820 shares of our Series B Preferred Stock, all of which were initially convertible into an aggregate of 366 shares of our common stock based on an initial preferred-to-common conversion ratio of approximately 1-for-0.03, and warrants to purchase an aggregate of 184 shares of our common stock at a split-adjusted exercise price of $735 per share, for an aggregate purchase price of $250,000. As a result of various anti-dilution adjustments, the conversion ratio of the Series B Preferred Stock has increased to approximately 1-for-0.68. For each of the years ended December 31, 2014 and 2013, we accrued and paid cash dividends in the amount of $17,500 in respect of shares of Series B Preferred Stock held by Mr. Jones.
On the following dates we entered into agreements with Mr. Jones under which the following amounts of accrued and unpaid dividends in respect of shares of Series B Preferred Stock held by Mr. Jones were to be paid in shares of our common stock at the following prices per share. We made such payments by issuing the following number of shares of common stock to Mr. Jones on the dates indicated.
| Agreement Date | Accrued Dividends | Price Per Share | Shares Issued | Issuance Date | ||||||||||
| August 21, 2012 | $ | 5,250 | $ | 4.65 | 1,129 | August 24, 2012 | ||||||||
| December 26, 2012 | $ | 5,250 | $ | 5.06 | 1,038 | December 31, 2012 | ||||||||
| March 27, 2013 | $ | 5,250 | $ | 5.25 | 1,000 | March 28, 2013 | ||||||||
| July 26, 2013 | $ | 5,250 | $ | 4.19 | 1,255 | July 31, 2013 | ||||||||
| September 13, 2013 | $ | 5,250 | $ | 3.72 | 1,413 | September 17, 2013 | ||||||||
| May 23, 2014 | $ | 10,500 | $ | 12.16 | 864 | May 28, 2014 | ||||||||
In November and December 2014, we paid cash in the aggregate amount of $15,748 to Mr. Jones representing all accrued and unpaid dividends in respect of shares of Series B Preferred Stock held by Mr. Jones. As of December 31, 2014, there were no accrued and unpaid dividends in respect of shares of Series B Preferred Stock held by Mr. Jones.
Michael D. Kandris
On January 4, 2013, we granted 10,000 shares of our restricted common stock to Mr. Kandris in consideration of services to be provided. The value of the common stock was determined to be $54,000.
On June 24, 2013, we granted 15,556 shares of our restricted common stock to Mr. Kandris in consideration of services to be provided. The value of the common stock was determined to be $58,179. On June 24, 2013, we also granted to Mr. Kandris an option to purchase up to 31,746 shares of our common stock at an exercise price of $3.74 per share as incentive compensation. The option vested as to approximately one-third of the shares on April 1, 2014 and vests as to approximately one-third of the shares on each of April 1, 2015 and 2016.
Christopher W. Wright
On March 1, 2013, we granted 23,333 shares of our restricted common stock to Mr. Wright in consideration of services to be provided. The value of the common stock was determined to be $133,004.
On June 24, 2013, we granted 15,556 shares of our restricted common stock to Mr. Wright in consideration of services to be provided. The value of the common stock was determined to be $58,179. On June 24, 2013, we also granted to Mr. Wright an option to purchase up to 31,746 shares of our common stock at an exercise price of $3.74 per share as incentive compensation. The option vested as to approximately one-third of the shares on April 1, 2014 and vests as to approximately one-third of the shares on each of April 1, 2015 and 2016.
| 99 |
Bryon T. McGregor
On March 1, 2013, we granted 23,333 shares of our restricted common stock to Mr. McGregor in consideration of services to be provided. The value of the common stock was determined to be $133,004.
On June 24, 2013, we granted 15,556 shares of our restricted common stock to Mr. McGregor in consideration of services to be provided. The value of the common stock was determined to be $58,179. On June 24, 2013, we also granted to Mr. McGregor an option to purchase up to 31,746 shares of our common stock at an exercise price of $3.74 per share as incentive compensation. The option vested as to approximately one-third of the shares on April 1, 2014 and vests as to approximately one-third of the shares on each of April 1, 2015 and 2016.
James R. Sneed
On June 24, 2013, we granted 11,667 shares of restricted common stock to Mr. Sneed in consideration of services to be provided. The value of the common stock was determined to be $43,635. On June 24, 2013, we also granted to Mr. Sneed an option to purchase up to 10,204 shares of our common stock at an exercise price of $3.74 per share as incentive compensation. The option vested as to approximately one-third of the shares on April 1, 2014 and vests as to approximately one-third of the shares on each of April 1, 2015 and 2016.
Terry L. Stone, John L. Prince, Douglas L. Kieta and Larry D. Layne
On January 4, 2013, we granted 10,000 shares of our restricted common stock to each of our non-employee directors (except for the Chairman of our Board, Mr. Jones) in consideration of services to be provided. The value of the common stock granted to each of Messrs. Stone, Prince, Kieta and Layne on January 4, 2013 was determined to be $53,925.
On June 24, 2013, we granted 13,333 shares of our restricted common stock to each of our non-employee directors (except for the Chairman of our Board, Mr. Jones) in consideration of services to be provided. The value of the common stock was determined to be $48,265.
Lyles United, LLC
On March 27, 2008, we sold to Lyles United, LLC, or Lyles United, 2,051,282 shares of our Series B Preferred Stock, all of which were initially convertible into an aggregate of 58,608 shares of our common stock based on an initial preferred-to-common conversion ratio of approximately 1-for-0.03, and warrants to purchase an aggregate of 29,304 shares of our common stock at a split-adjusted exercise price of $735 per share, for an aggregate purchase price of $40,000,000. As a result of various anti-dilution adjustments, the conversion ratio of the Series B Preferred Stock has increased to approximately 1-for-0.68. For each of the years ended December 31, 2014 and 2013, we accrued and paid cash dividends in the amount of $700,000 in respect of shares of Series B Preferred Stock held by Lyles United.
| 100 |
On the following dates we entered into agreements with Lyles United under which the following amounts of accrued and unpaid dividends in respect of shares of Series B Preferred Stock held by Lyles United were to be paid in shares of our common stock at the following prices per share. We made such payments by issuing the following number of shares of common stock to Lyles United on the dates indicated.
| Agreement Date | Accrued Dividends | Price Per Share | Shares Issued | Issuance Date | ||||||||||
| August 21, 2012 | $ | 367,068 | $ | 4.65 | 78,939 | August 24, 2012 | ||||||||
| December 26, 2012 | $ | 367,068 | $ | 5.06 | 72,552 | December 31, 2012 | ||||||||
| March 27, 2013 | $ | 367,068 | $ | 5.25 | 69,918 | March 28, 2013 | ||||||||
| July 26, 2013 | $ | 367,068 | $ | 4.19 | 87,683 | July 31, 2013 | ||||||||
| September 13, 2013 | $ | 367,068 | $ | 3.72 | 98,746 | September 17, 2013 | ||||||||
| May 23, 2014 | $ | 734,136 | $ | 12.16 | 60,374 | May 28, 2014 | ||||||||
In November and December 2014, we paid cash in the aggregate amount of $1,101,207 to Lyles United representing all accrued and unpaid dividends in respect of shares of Series B Preferred Stock held by Lyles United. As of December 31, 2014, there were no accrued and unpaid dividends in respect of shares of Series B Preferred Stock held by Lyles United.
Frank P. Greinke
Series B Preferred Stock
For each of the years ended December 31, 2014 and 2013, we accrued and paid cash dividends in the amount of $86,964 in respect of shares of Series B Preferred Stock held by the Greinke Personal Living Trust Dated April 20, 1999 (“Greinke Trust”). Frank P. Greinke is one of our former directors and the trustee of the holder of shares of our issued and outstanding Series B Preferred Stock. The Greinke Trust acquired its shares of Series B Preferred Stock from Lyles United in December 2009.
Shares of our Series B Preferred Stock, which were initially convertible into shares of our common stock based on an initial preferred-to-common conversion ratio of approximately 1-for-0.03, were converted into shares of our common stock based on lower conversion ratios resulting from various anti-dilution adjustments, thereby increasing the number of shares of common stock issued to the Greinke Trust in connection with its conversions of our Series B Preferred Stock. The current conversion ratio is approximately 1-for-0.68.
On the following dates we entered into agreements with the Greinke Trust under which the following amounts of accrued and unpaid dividends in respect of shares of Series B Preferred Stock held by the Greinke Trust were to be paid in shares of our common stock at the following prices per share. We made such payments by issuing the following number of shares of common stock to the Greinke Trust on the dates indicated.
| Agreement Date | Accrued Dividends | Price Per Share | Shares Issued | Issuance Date | ||||||||||
| August 21, 2012 | $ | 189,656 | $ | 4.65 | 40,786 | August 24, 2012 | ||||||||
| December 26, 2012 | $ | 189,656 | $ | 5.06 | 37,486 | December 31, 2012 | ||||||||
| March 27, 2013 | $ | 189,656 | $ | 5.25 | 36,128 | March 28, 2013 | ||||||||
| July 26, 2013 | $ | 189,656 | $ | 4.19 | 45,304 | July 31, 2013 | ||||||||
| September 13, 2013 | $ | 189,656 | $ | 3.72 | 51,020 | September 17, 2013 | ||||||||
| May 23, 2014 | $ | 379,312 | $ | 12.16 | 31,194 | May 28, 2014 | ||||||||
In November and December 2014, we paid cash in the aggregate amount of $568,971 to the Greinke Trust representing all accrued and unpaid dividends in respect of shares of Series B Preferred Stock held by the Greinke Trust. As of December 31, 2014, there were no accrued and unpaid dividends in respect of shares of Series B Preferred Stock held by the Greinke Trust.
| 101 |
| Item 14. | Principal Accounting Fees and Services. |
The following table presents fees for professional audit services rendered by Hein & Associates LLP for the years ended December 31, 2014 and 2013.
| 2014 | 2013 | |||||||
| Audit Fees | $ | 573,807 | $ | 331,639 | ||||
| Audit-Related Fees | 14,175 | 12,630 | ||||||
| Tax Fees | – | – | ||||||
| All Other Fees | – | – | ||||||
| Total | $ | 587,982 | $ | 344,269 | ||||
Audit Fees. Consist of amounts billed for professional services rendered for the audit of our annual consolidated financial statements included in our Annual Reports on Form 10-K, and reviews of our interim consolidated financial statements included in our Quarterly Reports on Form 10-Q and our Registration Statements on Forms S-1, S-3, and S-8, including amendments thereto, and the review of our internal accounting and reporting controls as required under Section 404 of the Sarbanes-Oxley Act of 2002.
Audit-Related Fees. Audit-Related Fees consist of fees billed for professional services that are reasonably related to the performance of the audit or review of our consolidated financial statements but are not reported under “Audit Fees.” Such fees would include amounts billed for professional services performed in connection with mergers and acquisitions. The fees for 2014 and 2013 represent amounts billed for professional services performed in connection with the audit of a 401(k) plan.
Tax Fees. Tax Fees consist of fees for professional services for tax compliance activities, including the preparation of federal and state tax returns and related compliance matters.
All Other Fees. Consists of amounts billed for services other than those noted above.
Hein & Associates LLP did not provide any non-audit services for the fiscal years ended December 31, 2014 and 2013. The Audit Committee did not, therefore, consider whether the provision of non-audit services by Hein & Associates LLP is compatible with maintaining its independence; however, the Audit Committee has satisfied itself with respect to Hein & Associates LLP’s independence.
Our Audit Committee is responsible for approving all audit, audit-related, tax and other services. The Audit Committee pre-approves all auditing services and permitted non-audit services, including all fees and terms to be performed for us by our independent auditor at the beginning of the fiscal year. Non-audit services are reviewed and pre-approved by project at the beginning of the fiscal year. Any additional non-audit services contemplated by us after the beginning of the fiscal year are submitted to the Chairman of our Audit Committee for pre-approval prior to engaging our independent auditor for such services. These interim pre-approvals are reviewed with the full Audit Committee at its next meeting for ratification. During 2014 and 2013, all services performed by Hein & Associates LLP were pre-approved by our Audit Committee in accordance with these policies and applicable Securities and Exchange Commission regulations.
| 102 |
PART IV
| Item 15. | Exhibits, Financial Statement Schedules. |
(a)(1) Financial Statements
Reference is made to the financial statements listed on and attached following the Index to Consolidated Financial Statements contained on page F-1 of this report.
(a)(2) Financial Statement Schedules
None.
(a)(3) Exhibits
Reference is made to the exhibits listed on the Index to Exhibits.
| 103 |
Index to Consolidated Financial Statements
| Reports of Independent Registered Public Accounting Firm | F-2 |
| Consolidated Balance Sheets as of December 31, 2014 and 2013 | F-4 |
| Consolidated Statements of Operations for the Years Ended December 31, 2014, 2013 and 2012 | F-6 |
| Consolidated Statements of Stockholders’ Equity for the Years Ended December 31, 2014, 2013 and 2012 | F-7 |
| Consolidated Statements of Cash Flows for the Years Ended December 31, 2014, 2013 and 2012 | F-8 |
| Notes to Consolidated Financial Statements | F-10 |
| F-1 |
REPORT OF INDEPENDENT REGISTERED PUBLIC ACCOUNTING FIRM
To the Board of Directors and Stockholders
Pacific Ethanol, Inc.
We have audited the accompanying consolidated balance sheets of Pacific Ethanol, Inc. and subsidiaries as of December 31, 2014 and 2013, and the related consolidated statements of operations, stockholders' equity, and cash flows for each of the three years ended December 31, 2014, 2013 and 2012. These financial statements are the responsibility of the Company's management. Our responsibility is to express an opinion on these financial statements based on our audits.
We conducted our audits in accordance with the standards of the Public Company Accounting Oversight Board (United States). Those standards require that we plan and perform the audit to obtain reasonable assurance about whether the financial statements are free of material misstatement. An audit includes examining, on a test basis, evidence supporting the amounts and disclosures in the financial statements. An audit also includes assessing the accounting principles used and significant estimates made by management, as well as evaluating the overall financial statement presentation. We believe that our audits provide a reasonable basis for our opinion.
In our opinion, the consolidated financial statements referred to above present fairly, in all material respects, the financial position of Pacific Ethanol, Inc. and subsidiaries as of December 31, 2014 and 2013, and the results of their operations and their cash flows for each of the three years ended December 31, 2014, 2013 and 2012, in conformity with U.S. generally accepted accounting principles.
We have also audited, in accordance with the standards of the Public Company Accounting Oversight Board (United States), Pacific Ethanol, Inc.'s and subsidiaries’ internal control over financial reporting as of December 31, 2014, based on criteria established in Internal Control — Integrated Framework issued by the Committee of Sponsoring Organizations of the Treadway Commission in 2013, and our report dated March 16, 2015 expressed an unqualified opinion on the effectiveness of Pacific Ethanol, Inc.’s internal control over financial reporting.
/s/ Hein & Associates LLP
Irvine, California
March 16, 2015
| F-2 |
REPORT OF INDEPENDENT REGISTERED PUBLIC ACCOUNTING FIRM
To the Board of Directors and Stockholders
Pacific Ethanol, Inc.
We have audited Pacific Ethanol, Inc.'s internal control over financial reporting as of December 31, 2014, based on criteria established in Internal Control — Integrated Framework issued by the Committee of Sponsoring Organizations of the Treadway Commission in 2013. Pacific Ethanol, Inc.’s management is responsible for maintaining effective internal control over financial reporting and for its assessment of the effectiveness of internal control over financial reporting included in the accompanying Management’s Report on Internal Control over Financial Reporting. Our responsibility is to express an opinion on the company's internal control over financial reporting based on our audit.
We conducted our audit in accordance with the standards of the Public Company Accounting Oversight Board (United States). Those standards require that we plan and perform the audit to obtain reasonable assurance about whether effective internal control over financial reporting was maintained in all material respects. Our audit included obtaining an understanding of internal control over financial reporting, assessing the risk that a material weakness exists, and testing and evaluating the design and operating effectiveness of internal control based on the assessed risk. Our audit also included performing such other procedures as we considered necessary in the circumstances. We believe that our audit provides a reasonable basis for our opinion.
A company's internal control over financial reporting is a process designed to provide reasonable assurance regarding the reliability of financial reporting and the preparation of financial statements for external purposes in accordance with generally accepted accounting principles. A company's internal control over financial reporting includes those policies and procedures that (a) pertain to the maintenance of records that, in reasonable detail, accurately and fairly reflect the transactions and dispositions of the assets of the company; (b) provide reasonable assurance that transactions are recorded as necessary to permit preparation of financial statements in accordance with generally accepted accounting principles, and that receipts and expenditures of the company are being made only in accordance with authorizations of management and directors of the company; and (c) provide reasonable assurance regarding prevention or timely detection of unauthorized acquisition, use, or disposition of the company's assets that could have a material effect on the financial statements.
Because of its inherent limitations, internal control over financial reporting may not prevent or detect misstatements. Also, projections of any evaluation of effectiveness to future periods are subject to the risk that controls may become inadequate because of changes in conditions, or that the degree of compliance with the policies or procedures may deteriorate.
In our opinion, Pacific Ethanol, Inc. maintained, in all material respects, effective internal control over financial reporting as of December 31, 2014, based on criteria established in Internal Control — Integrated Framework issued by the Committee of Sponsoring Organizations of the Treadway Commission in 2013.
We have also audited, in accordance with the standards of the Public Company Accounting Oversight Board (United States), the consolidated balance sheets of Pacific Ethanol, Inc. and subsidiaries as of December 31, 2014 and 2013, and the related consolidated statements of operations, stockholders’ equity, and cash flows for each of the three years ended December 31, 2014, 2013 and 2012 and our report dated March 16, 2015 expressed an unqualified opinion.
/s/ Hein & Associates LLP
Irvine, California
March 16, 2015
| F-3 |
PACIFIC ETHANOL,
INC.
CONSOLIDATED BALANCE SHEETS
(in thousands, except shares and par value)
| December 31, | ||||||||
| 2014 | 2013 | |||||||
| ASSETS | ||||||||
| Current Assets: | ||||||||
| Cash and cash equivalents | $ | 62,084 | $ | 5,151 | ||||
| Accounts receivable, net of allowance for doubtful accounts of $6 and $187, respectively | 34,612 | 35,296 | ||||||
| Inventories | 18,550 | 23,386 | ||||||
| Prepaid inventory | 11,595 | 12,315 | ||||||
| Other current assets | 12,710 | 3,229 | ||||||
| Total current assets | 139,551 | 79,377 | ||||||
| Total property and equipment, net | 155,302 | 155,194 | ||||||
| Other Assets: | ||||||||
| Intangible assets, net | 2,786 | 3,260 | ||||||
| Other assets | 1,863 | 3,218 | ||||||
| Total other assets | 4,649 | 6,478 | ||||||
| Total Assets | $ | 299,502 | $ | 241,049 | ||||
The accompanying notes are an integral part of these consolidated financial statements.
| F-4 |
PACIFIC ETHANOL, INC.
CONSOLIDATED BALANCE SHEETS (CONTINUED)
(in thousands, except shares and par value)
| December 31, | ||||||||
| 2014 | 2013 | |||||||
| LIABILITIES AND STOCKHOLDERS’ EQUITY | ||||||||
| Current Liabilities: | ||||||||
| Accounts payable – trade | $ | 13,122 | $ | 11,071 | ||||
| Accrued liabilities | 6,203 | 5,851 | ||||||
| Current portion – capital leases | 4,077 | 4,830 | ||||||
| Current portion – long-term debt ($0 and $750 due to a related party, respectively) | – | 750 | ||||||
| Other current liabilities | 2,045 | 5,714 | ||||||
| Total current liabilities | 25,447 | 28,216 | ||||||
| Long-term debt, net of current portion | 34,533 | 98,408 | ||||||
| Accrued preferred dividends | – | 3,657 | ||||||
| Capital leases, net of current portion | 2,055 | 6,041 | ||||||
| Warrant liabilities at fair value | 1,986 | 8,215 | ||||||
| Deferred tax liabilities | 17,040 | 1,091 | ||||||
| Other liabilities | 459 | 520 | ||||||
| Total Liabilities | 81,520 | 146,148 | ||||||
| Commitments and contingencies (Notes 1, 5, 6 and 11) | ||||||||
| Stockholders’ Equity: | ||||||||
| Preferred stock, $0.001 par value; 10,000,000 shares authorized: | ||||||||
| Series A: 1,684,375 shares authorized; no shares issued and outstanding as of December 31, 2014 and 2013 | – | – | ||||||
| Series B: 1,580,790 shares authorized; 926,942 shares issued and outstanding as of December 31, 2014 and 2013; liquidation preference of $18,075 as of December 31, 2014 | 1 | 1 | ||||||
| Common stock, $0.001 par value; 300,000,000 shares authorized; 24,499,534 and 16,126,287 shares issued and outstanding as of December 31, 2014 and 2013, respectively | 25 | 16 | ||||||
| Additional paid-in capital | 725,813 | 621,557 | ||||||
| Accumulated deficit | (512,332 | ) | (532,356 | ) | ||||
| Total Pacific Ethanol, Inc. stockholders’ equity | 213,507 | 89,218 | ||||||
| Noncontrolling interests | 4,475 | 5,683 | ||||||
| Total stockholders’ equity | 217,982 | 94,901 | ||||||
| Total Liabilities and Stockholders’ Equity | $ | 299,502 | $ | 241,049 | ||||
The accompanying notes are an integral part of these consolidated financial statements.
| F-5 |
PACIFIC ETHANOL, INC.
CONSOLIDATED STATEMENTS OF OPERATIONS
(in thousands, except per share data)
| Years Ended December 31, | ||||||||||||
| 2014 | 2013 | 2012 | ||||||||||
| Net sales | $ | 1,107,412 | $ | 908,437 | $ | 816,044 | ||||||
| Cost of goods sold | 998,927 | 875,507 | 835,568 | |||||||||
| Gross profit (loss) | 108,485 | 32,930 | (19,524 | ) | ||||||||
| Selling, general and administrative expenses | 17,108 | 14,021 | 12,141 | |||||||||
| Income (loss) from operations | 91,377 | 18,909 | (31,665 | ) | ||||||||
| Fair value adjustments and warrant inducements | (37,532 | ) | (1,013 | ) | 1,954 | |||||||
| Interest expense, net | (9,438 | ) | (15,671 | ) | (13,049 | ) | ||||||
| Loss on extinguishments of debt | (2,363 | ) | (3,035 | ) | – | |||||||
| Other expense, net | (905 | ) | (352 | ) | (595 | ) | ||||||
| Income (loss) before provision for income taxes | 41,139 | (1,162 | ) | (43,355 | ) | |||||||
| Provision for income taxes | 15,137 | – | – | |||||||||
| Consolidated net income (loss) | 26,002 | (1,162 | ) | (43,355 | ) | |||||||
| Net (income) loss attributed to noncontrolling interests | (4,713 | ) | 381 | 24,298 | ||||||||
| Net income (loss) attributed to Pacific Ethanol, Inc. | $ | 21,289 | $ | (781 | ) | $ | (19,057 | ) | ||||
| Preferred stock dividends | $ | (1,265 | ) | $ | (1,265 | ) | $ | (1,268 | ) | |||
| Income (loss) available to common stockholders | $ | 20,024 | $ | (2,046 | ) | $ | (20,325 | ) | ||||
| Income (loss) per share, basic | $ | 0.96 | $ | (0.17 | ) | $ | (2.81 | ) | ||||
| Income (loss) per share, diluted | $ | 0.88 | $ | (0.17 | ) | $ | (2.81 | ) | ||||
| Weighted-average shares outstanding, basic | 20,810 | 12,264 | 7,224 | |||||||||
| Weighted-average shares outstanding, diluted | 22,669 | 12,264 | 7,224 | |||||||||
The accompanying notes are an integral part of these consolidated financial statements.
| F-6 |
PACIFIC ETHANOL, INC.
CONSOLIDATED STATEMENTS OF STOCKHOLDERS’ EQUITY
(in thousands)
| Additional | Non- | |||||||||||||||||||||||||||||||
| Preferred Stock | Common Stock | Paid-In | Accumulated | Controlling | ||||||||||||||||||||||||||||
| Shares | Amount | Shares | Amount | Capital | Deficit | Interests | Total | |||||||||||||||||||||||||
| Balances, January 1, 2012 | 927 | $ | 1 | 5,775 | $ | 6 | $ | 556,952 | $ | (509,985 | ) | $ | 72,290 | $ | 119,264 | |||||||||||||||||
| Stock-based compensation expense – restricted stock and options to employees and directors, net of cancellations | – | – | (3 | ) | – | 806 | – | – | 806 | |||||||||||||||||||||||
| Shares issued on equity offerings | – | – | 3,700 | 4 | 15,856 | – | – | 15,860 | ||||||||||||||||||||||||
| Warrant exercises | – | – | 15 | – | 139 | – | – | 139 | ||||||||||||||||||||||||
| Shares issued as payment of prior unpaid Series B preferred dividends | – | – | 302 | – | 1,462 | – | – | 1,462 | ||||||||||||||||||||||||
| Purchases of interests in PE Op Co. | – | – | – | – | 7,646 | – | (27,647 | ) | (20,001 | ) | ||||||||||||||||||||||
| Preferred stock dividends | – | – | – | – | – | (1,268 | ) | – | (1,268 | ) | ||||||||||||||||||||||
| Net loss | – | – | – | – | – | (19,057 | ) | (24,298 | ) | (43,355 | ) | |||||||||||||||||||||
| Balances, December 31, 2012 | 927 | $ | 1 | 9,789 | $ | 10 | $ | 582,861 | $ | (530,310 | ) | $ | 20,345 | $ | 72,907 | |||||||||||||||||
| Stock-based compensation expense – restricted stock and options to employees and directors, net of cancellations | – | – | 600 | 1 | 1,696 | – | – | 1,697 | ||||||||||||||||||||||||
| Shares issued on convertible notes | – | – | 4,446 | 4 | 18,551 | – | – | 18,555 | ||||||||||||||||||||||||
| Shares issued on senior notes | – | – | 500 | – | 2,000 | – | – | 2,000 | ||||||||||||||||||||||||
| Warrant exercises | – | – | 280 | – | 2,317 | – | – | 2,317 | ||||||||||||||||||||||||
| Shares issued as payment of prior unpaid Series B preferred dividends | – | – | 511 | 1 | 2,192 | – | – | 2,193 | ||||||||||||||||||||||||
| Purchases of interests in PE Op Co. | – | – | – | – | 11,940 | – | (14,281 | ) | (2,341 | ) | ||||||||||||||||||||||
| Preferred stock dividends | – | – | – | – | – | (1,265 | ) | – | (1,265 | ) | ||||||||||||||||||||||
| Net loss | – | – | – | – | – | (781 | ) | (381 | ) | (1,162 | ) | |||||||||||||||||||||
| Balances, December 31, 2013 | 927 | $ | 1 | 16,126 | $ | 16 | $ | 621,557 | $ | (532,356 | ) | $ | 5,683 | $ | 94,901 | |||||||||||||||||
| Stock-based compensation expense – restricted stock issued to employees and directors, net of cancellations and tax | – | – | 90 | – | 1,890 | – | – | 1,890 | ||||||||||||||||||||||||
| Issuance of common stock | – | – | 1,750 | 2 | 26,071 | – | – | 26,073 | ||||||||||||||||||||||||
| Warrant exercises | – | – | 6,413 | 6 | 85,156 | – | – | 85,162 | ||||||||||||||||||||||||
| Shares issued as payment of prior unpaid Series B preferred dividends | – | – | 120 | 1 | 1,462 | – | – | 1,463 | ||||||||||||||||||||||||
| Purchases of interests in PE Op Co. | – | – | – | – | (79 | ) | – | (5,921 | ) | (6,000 | ) | |||||||||||||||||||||
| Tax impact of purchases of interests in PE Op Co. | – | – | – | – | (10,244 | ) | – | – | (10,244 | ) | ||||||||||||||||||||||
| Preferred stock dividends | – | – | – | – | – | (1,265 | ) | – | (1,265 | ) | ||||||||||||||||||||||
| Net income | – | – | – | – | – | 21,289 | 4,713 | 26,002 | ||||||||||||||||||||||||
| Balances, December 31, 2014 | 927 | $ | 1 | 24,499 | $ | 25 | $ | 725,813 | $ | (512,332 | ) | $ | 4,475 | $ | 217,982 | |||||||||||||||||
The accompanying notes are an integral part of these consolidated financial statements.
| F-7 |
PACIFIC ETHANOL, INC.
CONSOLIDATED STATEMENTS OF CASH FLOWS
(in thousands)
| For the Years Ended December 31, | ||||||||||||
| 2014 | 2013 | 2012 | ||||||||||
| Operating Activities: | ||||||||||||
| Consolidated net income (loss) | $ | 26,002 | $ | (1,162 | ) | $ | (43,355 | ) | ||||
| Adjustments to reconcile consolidated net income (loss) to cash provided by (used in) operating activities: | ||||||||||||
| Depreciation and amortization of intangibles | 13,186 | 12,136 | 12,205 | |||||||||
| Fair value adjustments | 35,260 | 227 | (1,954 | ) | ||||||||
| Loss on extinguishments of debt | 2,363 | 3,035 | – | |||||||||
| Deferred income taxes | 5,129 | – | – | |||||||||
| Inventory valuation | 970 | 8 | 816 | |||||||||
| Change in fair value on commodity derivative instruments | 808 | 1,821 | (999 | ) | ||||||||
| Amortization of deferred financing costs | 1,217 | 2,009 | 736 | |||||||||
| Amortization of debt discounts | 1,815 | 1,272 | – | |||||||||
| Noncash compensation | 1,838 | 1,724 | 806 | |||||||||
| Bad debt expense (recovery) | (42 | ) | 169 | (6 | ) | |||||||
| Loss on disposals of assets | 439 | – | – | |||||||||
| Interest expense added to Plant Owners’ debt | – | 4,745 | 3,542 | |||||||||
| Interest on convertible debt paid with stock | – | 111 | – | |||||||||
| Changes in operating assets and liabilities: | ||||||||||||
| Accounts receivable | 726 | (9,414 | ) | 2,095 | ||||||||
| Inventories | 3,866 | (2,150 | ) | (929 | ) | |||||||
| Prepaid expenses and other assets | (7,818 | ) | (2,340 | ) | 2,251 | |||||||
| Prepaid inventory | 720 | (6,893 | ) | 3,817 | ||||||||
| Accounts payable and accrued expenses | 1,853 | 8,889 | 129 | |||||||||
| Net cash provided by (used in) operating activities | $ | 88,332 | $ | 14,187 | $ | (20,846 | ) | |||||
| Investing Activities: | ||||||||||||
| Additions to property and equipment | $ | (13,259 | ) | $ | (3,993 | ) | $ | (2,273 | ) | |||
| Purchases of PE Op Co. ownership interests | (6,000 | ) | (2,340 | ) | (10,000 | ) | ||||||
| Net cash used in investing activities | $ | (19,259 | ) | $ | (6,333 | ) | $ | (12,273 | ) | |||
| Financing Activities: | ||||||||||||
| Net proceeds from common stock and warrants | $ | 26,073 | $ | – | $ | 20,924 | ||||||
| Proceeds from warrant exercises | 43,676 | 2,064 | – | |||||||||
| Proceeds from senior notes and warrants | – | 22,192 | – | |||||||||
| Proceeds from subordinated convertible notes and warrants | – | 14,000 | – | |||||||||
| Proceeds from Plant Owners’ borrowings | – | 7,000 | 24,022 | |||||||||
| Payments on Plant Owners’ borrowings | (39,792 | ) | (17,115 | ) | – | |||||||
| Purchase of Plant Owners’ debt | (17,038 | ) | (27,088 | ) | – | |||||||
| Net payments on Kinergy’s line of credit | (1,512 | ) | (669 | ) | (721 | ) | ||||||
| Payments on senior unsecured notes | (13,984 | ) | (6,208 | ) | (10,000 | ) | ||||||
| Debt issuance costs | (438 | ) | (1,560 | ) | (1,166 | ) | ||||||
| Payment on related party note | (750 | ) | – | – | ||||||||
| Preferred stock dividend payments | (3,459 | ) | (1,265 | ) | (1,268 | ) | ||||||
| Payments on capital leases | (4,916 | ) | (1,640 | ) | – | |||||||
| Net cash (used in) provided by financing activities | $ | (12,140 | ) | $ | (10,289 | ) | $ | 31,791 | ||||
| Net increase (decrease) in cash and cash equivalents | 56,933 | (2,435 | ) | (1,328 | ) | |||||||
| Cash and cash equivalents at beginning of period | 5,151 | 7,586 | 8,914 | |||||||||
| Cash and cash equivalents at end of period | $ | 62,084 | $ | 5,151 | $ | 7,586 | ||||||
The accompanying notes are an integral part of these consolidated financial statements.
| F-8 |
PACIFIC ETHANOL, INC.
CONSOLIDATED STATEMENTS OF CASH FLOWS
(in thousands)
| For the Years Ended December 31, | ||||||||||||
| 2014 | 2013 | 2012 | ||||||||||
| Supplemental Information: | ||||||||||||
| Interest paid | $ | 6,596 | $ | 7,515 | $ | 8,828 | ||||||
| Income taxes paid | $ | 17,930 | $ | – | $ | – | ||||||
| Noncash financing and investing activities: | ||||||||||||
| Preferred stock dividends paid in common stock | $ | 1,463 | $ | 2,192 | $ | 1,464 | ||||||
| Notes issued for purchase of 33% ownership in PE Op Co. | $ | – | $ | – | $ | 10,000 | ||||||
| Capital leases added to plant and equipment | $ | – | $ | 12,829 | $ | – | ||||||
| Original discount on senior and convertible debt | $ | – | $ | 8,558 | $ | – | ||||||
| Purchase of sugar inventory with note | $ | – | $ | 5,000 | $ | – | ||||||
| Reclass of warrant liability to equity upon exercises | $ | 41,486 | $ | 260 | $ | 113 | ||||||
| Reclass of noncontrolling interest to APIC upon acquisitions of ownership interests in PE Op Co. | $ | (79 | ) | $ | 11,940 | $ | 7,646 | |||||
| Debt extinguished with issuance of common stock | $ | – | $ | 16,000 | $ | – | ||||||
The accompanying notes are an integral part of these consolidated financial statements.
| F-9 |
PACIFIC ETHANOL, INC.
NOTES TO CONSOLIDATED FINANCIAL STATEMENTS
| 1. | ORGANIZATION AND SIGNIFICANT ACCOUNTING POLICIES. |
Organization and Business – The consolidated financial statements include, for all periods presented, the accounts of Pacific Ethanol, Inc., a Delaware corporation (“Pacific Ethanol”), and its direct and indirect subsidiaries, including its wholly-owned subsidiaries, Kinergy Marketing, LLC, an Oregon limited liability company (“Kinergy”), Pacific Ag. Products, LLC, a California limited liability company (“PAP”) and PE Op Co., a Delaware corporation (“PE Op Co.,” formerly, New PE Holdco LLC, a Delaware limited liability company), which owns the Plant Owners (as defined below) (collectively, the “Company”).
The Company is the leading producer and marketer of low-carbon renewable fuels in the Western United States. The Company also sells ethanol co-products, including wet distillers grain (“WDG”), a nutritious animal feed, and corn oil. Serving integrated oil companies and gasoline marketers who blend ethanol into gasoline, the Company provides transportation, storage and delivery of ethanol through third-party service providers in the Western United States, primarily in California, Arizona, Nevada, Utah, Oregon, Colorado, Idaho and Washington. The Company had a 96%, 91% and 67% ownership interest in PE Op Co., the owner of four ethanol production facilities, as of December 31, 2014, 2013 and 2012, respectively. The facilities are near their respective fuel and feed customers, offering significant timing, transportation cost and logistical advantages. The Company sells ethanol produced by the Pacific Ethanol Plants (as defined below) and unrelated third parties to gasoline refining and distribution companies, sells its WDG to dairy operators and animal feed distributors and sells its corn oil to poultry and biodiesel customers.
The Company manages the production and operation of the following four ethanol production facilities: Pacific Ethanol Madera LLC, Pacific Ethanol Columbia, LLC, Pacific Ethanol Stockton LLC and Pacific Ethanol Magic Valley, LLC (collectively, the “Pacific Ethanol Plants”) and their holding company, Pacific Ethanol Holding Co. LLC (“PEHC,” and together with the Pacific Ethanol Plants, the “Plant Owners”). PEHC is a wholly-owned subsidiary of PE Op Co. These four facilities have an aggregate annual ethanol production capacity of up to 200 million gallons. As of December 31, 2014, all four facilities were operating. On April 30, 2014, the Company’s previously idled facility in Madera, California commenced producing ethanol. As market conditions change, the Company may increase, decrease or idle production at one or more operational facilities or resume operations at any idled facility.
Basis of Presentation – The consolidated financial statements and related notes have been prepared in accordance with accounting principles generally accepted in the United States (“GAAP”) and include the accounts of the Company. All significant intercompany accounts and transactions have been eliminated in consolidation.
Consolidation of Variable Interest Entities – The Company applies the guidance in the Financial Accounting Standards Board’s (“FASB”) Accounting Standards Codification 810, Consolidation, surrounding a company’s analysis to determine whether any of its variable interests constitute controlling financial interests in a variable interest entity (“VIE”). This analysis identifies the primary beneficiary of a VIE as the enterprise that has both of the following characteristics: (i) the power to direct the activities of a VIE that most significantly impact the entity’s economic performance, and (ii) the obligation to absorb losses of the entity that could potentially be significant to the VIE or the right to receive benefits from the entity that could potentially be significant to the VIE. Additionally, an enterprise is required to assess whether it has an implicit financial responsibility to ensure that a VIE operates as designed when determining whether it has the power to direct the activities of the VIE that most significantly impact the entity’s economic performance. The guidance also requires ongoing reassessments of whether an enterprise is the primary beneficiary of a VIE.
| F-10 |
PACIFIC ETHANOL, INC.
NOTES TO CONSOLIDATED FINANCIAL STATEMENTS
On October 6, 2010, the Company purchased an initial 20% ownership interest in PE Op Co., a VIE at the time, from a number of PE Op Co.’s owners. At that time, the Company determined it was the primary beneficiary of PE Op Co., and as such, has since consolidated the results of PE Op Co. Through various transactions, the Company increased its ownership interest in PE Op Co. to 67% at December 31, 2012. In 2013, the Company increased its ownership interest in PE Op Co. through various transactions in January, March, June and December 2013, acquiring additional ownership interests of 13%, 3%, 2% and 6%, respectively, bringing its ownership to 91% at December 31, 2013. In 2014, the Company increased its ownership in PE Op Co. bringing its ownership to 96% at December 31, 2014.
Since December 2013, as a result of owning 91% of PE Op Co., the Company, with its significant majority position, has the ability to make most all decisions on its own, and has therefore determined that PE Op Co. is no longer considered a VIE. The Company continues to consolidate PE Op Co.’s financial results, however, now under the voting rights model. Consequently, since the Company does not wholly-own PE Op Co., it must adjust its consolidated net income (loss) for the income (loss) attributed to PE Op Co.’s other owners. The remaining amount after this adjustment results in net income (loss) attributed to Pacific Ethanol, Inc.
Reverse Stock Split – On May 14, 2013, the Company effected a one-for-fifteen reverse stock split. All share and per share information has been restated to retroactively show the effect of this stock split.
Cash and Cash Equivalents – The Company considers all highly-liquid investments with an original maturity of three months or less to be cash equivalents.
Accounts Receivable and Allowance for Doubtful Accounts – Trade accounts receivable are presented at face value, net of the allowance for doubtful accounts. The Company sells ethanol to gasoline refining and distribution companies, sells WDG to dairy operators and animal feed distributors and sells corn oil to poultry and biodiesel customers generally without requiring collateral. Due to a limited number of ethanol customers, the Company had significant concentrations of credit risk from sales of ethanol as of December 31, 2014 and 2013, as described below.
The Company maintains an allowance for doubtful accounts for balances that appear to have specific collection issues. The collection process is based on the age of the invoice and requires attempted contacts with the customer at specified intervals. If, after a specified number of days, the Company has been unsuccessful in its collection efforts, a bad debt allowance is recorded for the balance in question. Delinquent accounts receivable are charged against the allowance for doubtful accounts once uncollectibility has been determined. The factors considered in reaching this determination are the apparent financial condition of the customer and the Company’s success in contacting and negotiating with the customer. If the financial condition of the Company’s customers were to deteriorate, resulting in an impairment of ability to make payments, additional allowances may be required.
Of the accounts receivable balance, approximately $28,427,000 and $27,487,000 at December 31, 2014 and 2013, respectively, were used as collateral under Kinergy’s operating line of credit. The allowance for doubtful accounts was $6,000 and $187,000 as of December 31, 2014 and 2013, respectively. The Company recorded a bad debt recovery of $42,000, an expense of $169,000 and a bad debt recovery of $6,000 for the years ended December 31, 2014, 2013 and 2012, respectively. The Company does not have any off-balance sheet credit exposure related to its customers.
| F-11 |
PACIFIC ETHANOL, INC.
NOTES TO CONSOLIDATED FINANCIAL STATEMENTS
Concentrations of Credit Risk – Credit risk represents the accounting loss that would be recognized at the reporting date if counterparties failed completely to perform as contracted. Concentrations of credit risk, whether on- or off-balance sheet, that arise from financial instruments exist for groups of customers or counterparties when they have similar economic characteristics that would cause their ability to meet contractual obligations to be similarly affected by changes in economic or other conditions described below. Financial instruments that subject the Company to credit risk consist of cash balances maintained in excess of federal depository insurance limits and accounts receivable, which have no collateral or security. The Company has not experienced any significant losses in such accounts and believes that it is not exposed to any significant risk of loss of cash.
The Company sells fuel-grade ethanol to gasoline refining and distribution companies. The Company sold ethanol to customers representing 10% or more of the Company’s total net sales, as follows.
| Years Ended December 31, | ||||||||||||
| 2014 | 2013 | 2012 | ||||||||||
| Customer A | 20% | 23% | 21% | |||||||||
| Customer B | 20% | 17% | 16% | |||||||||
| Customer C | 8% | 12% | 12% | |||||||||
| Customer D | 11% | 6% | 2% | |||||||||
The Company had accounts receivable due from these customers totaling $20,706,000 and $17,513,000, representing 59% and 50% of total accounts receivable as of December 31, 2014 and 2013, respectively.
The Company purchases fuel-grade ethanol and corn, its largest cost component in producing ethanol, from its suppliers. The Company purchased ethanol and corn from suppliers representing 10% or more of the Company’s total purchases for the purchase and production of ethanol, as follows:
| Years Ended December 31, | ||||||||||||
| 2014 | 2013 | 2012 | ||||||||||
| Supplier A | 26% | 37% | 40% | |||||||||
| Supplier B | 15% | 14% | 14% | |||||||||
| Supplier C | 12% | 8% | 10% | |||||||||
Inventories – Inventories consisted primarily of bulk ethanol, beet sugar and unleaded fuel, and are valued at the lower-of-cost-or-market, with cost determined on a first-in, first-out basis. Inventory balances consisted of the following (in thousands):
| December 31, | ||||||||
| 2014 | 2013 | |||||||
| Finished goods | $ | 11,118 | $ | 10,287 | ||||
| Raw materials | 2,695 | 9,418 | ||||||
| Work in progress | 3,274 | 2,766 | ||||||
| Other | 1,463 | 915 | ||||||
| Total | $ | 18,550 | $ | 23,386 | ||||
| F-12 |
PACIFIC ETHANOL, INC.
NOTES TO CONSOLIDATED FINANCIAL STATEMENTS
Property and Equipment – Property and equipment are stated at cost. Depreciation is computed using the straight-line method over the following estimated useful lives:
| Buildings | 40 years |
| Facilities and plant equipment | 10 – 25 years |
| Other equipment, vehicles and furniture | 5 – 10 years |
The cost of normal maintenance and repairs is charged to operations as incurred. Significant capital expenditures that increase the life of an asset are capitalized and depreciated over the estimated remaining useful life of the asset. The cost of fixed assets sold, or otherwise disposed of, and the related accumulated depreciation or amortization are removed from the accounts, and any resulting gains or losses are reflected in current operations.
Intangible Assets – The Company amortizes intangible assets with definite lives using the straight-line method over their established lives, generally 2-10 years. Additionally, the Company tests these assets with established lives for impairment if conditions exist that indicate that carrying values may not be recoverable. Possible conditions leading to the unrecoverability of these assets include changes in market conditions, changes in future economic conditions or changes in technological feasibility that impact the Company’s assessments of future operations. If the Company determines that an impairment charge is needed, the charge will be recorded as asset impairment in the consolidated statements of operations.
Deferred Financing Costs – Deferred financing costs, which are included in other assets, are costs incurred to obtain debt financing, including all related fees, and are amortized as interest expense over the term of the related financing using the straight-line method which approximates the interest rate method. Amortization of deferred financing costs was $779,000, $2,009,000 and $736,000 for the years ended December 31, 2014, 2013 and 2012, respectively. Unamortized deferred financing costs were approximately $356,000 at December 31, 2014 and are recorded in other assets in the consolidated balance sheets.
Derivative Instruments and Hedging Activities – Derivative transactions, which can include forward contracts and futures positions on the New York Mercantile Exchange and the Chicago Board of Trade are recorded on the balance sheet as assets and liabilities based on the derivative’s fair value. Changes in the fair value of derivative contracts are recognized currently in income unless specific hedge accounting criteria are met. If derivatives meet those criteria, effective gains and losses are deferred in accumulated other comprehensive income (loss) and later recorded together with the hedged item in consolidated income (loss). For derivatives designated as a cash flow hedge, the Company formally documents the hedge and assesses the effectiveness with associated transactions. The Company has designated and documented contracts for the physical delivery of commodity products to and from counterparties as normal purchases and normal sales.
Revenue Recognition – The Company recognizes revenue when it is realized or realizable and earned. The Company considers revenue realized or realizable and earned when there is persuasive evidence of an arrangement, delivery has occurred, the sales price is fixed or determinable, and collection is reasonably assured. The Company derives revenue primarily from sales of ethanol and related co-products. The Company recognizes revenue when title transfers to its customers, which is generally upon the delivery of these products to a customer’s designated location. These deliveries are made in accordance with sales commitments and related sales orders entered into either verbally or in writing with customers. The sales commitments and related sales orders provide quantities, pricing and conditions of sales. In this regard, the Company engages in three basic types of revenue generating transactions:
| · | As a producer. Sales as a producer consist of sales of the Company’s inventory produced at the Pacific Ethanol Plants. |
| · | As a merchant. Sales as a merchant consist of sales to customers through purchases from third-party suppliers in which the Company may or may not obtain physical control of the ethanol or co-products, in which shipments are directed from the Company’s suppliers to its terminals or direct to its customers but for which the Company accepts the risk of loss in the transactions. |
| · | As an agent. Sales as an agent consist of sales to customers through purchases from third-party suppliers in which the risks and rewards of inventory ownership remain with third-party suppliers and the Company receives a predetermined service fee under these transactions. |
| F-13 |
PACIFIC ETHANOL, INC.
NOTES TO CONSOLIDATED FINANCIAL STATEMENTS
Revenue from sales of third-party ethanol and co-products is recorded net of costs when the Company is acting as an agent between a customer and a supplier and gross when the Company is a principal to the transaction. The Company recorded $1,908,000, $1,928,000 and $2,756,000 in net sales when acting as an agent for the years ended December 31, 2014, 2013 and 2012, respectively. Several factors are considered to determine whether the Company is acting as an agent or principal, most notably whether the Company is the primary obligor to the customer and whether the Company has inventory risk and related risk of loss or whether the Company adds meaningful value to the supplier’s product or service. Consideration is also given to whether the Company has latitude in establishing the sales price or has credit risk, or both. When the Company acts as an agent, it recognizes revenue on a net basis or recognizes its predetermined fees and any associated freight, based upon the amount of net revenues retained in excess of amounts paid to suppliers.
The Company records revenues based upon the gross amounts billed to its customers in transactions where the Company acts as a producer or a merchant and obtains title to ethanol and its co-products and therefore owns the product and any related, unmitigated inventory risk for the ethanol, regardless of whether the Company actually obtains physical control of the product.
Shipping and Handling Costs – Shipping and handling costs are classified as a component of cost of goods sold in the accompanying consolidated statements of operations.
California Ethanol Producer Incentive Program – The Company participated in the California Ethanol Producer Incentive Program (“CEPIP”) through the Pacific Ethanol Plants located in California since the program’s inception in 2010. The CEPIP was a program to provide funds to an eligible California facility—up to $0.25 per gallon of production—when current production corn crush spreads, measured as the difference between specified ethanol and corn index prices, were less than prescribed levels determined by the California Energy Commission. As of December 31, 2014, the program is no longer funded. For any month in which a payment was made by the CEPIP, the Company would be required to reimburse the funds within the subsequent five years from each payment date, if the corn crush spread exceeded $1.00 per gallon. In 2010 and 2011, the Company received an aggregate of $2,000,000 in CEPIP funds. Since these funds were provided to subsidize low production costs and encourage eligible facilities to either continue production or start up production in low margin environments, the Company recorded the proceeds as a credit to cost of goods sold in the periods the funds were received. For the years ended December 31, 2014, 2013 and 2012, the Company recorded aggregate amounts of $1,878,000, $122,000 and $0 as cost of goods sold, respectively, in respect of the Company’s repayments under the CEPIP to the California Energy Commission.
Stock-Based Compensation – The Company accounts for the cost of employee services received in exchange for the award of equity instruments based on the fair value of the award, determined on the date of grant. The expense is to be recognized over the period during which an employee is required to provide services in exchange for the award. The Company estimates forfeitures at the time of grant and makes revisions, if necessary, in the second quarter of each year if actual forfeitures differ from those estimates. Based on historical experience, the Company estimated future unvested forfeitures at 8% for the years ended December 31, 2014 and 2013 and 5% for the year ended December 31, 2012. The Company recognizes stock-based compensation expense as a component of selling, general and administrative expenses in the consolidated statements of operations.
| F-14 |
PACIFIC ETHANOL, INC.
NOTES TO CONSOLIDATED FINANCIAL STATEMENTS
Impairment of Long-Lived Assets – The Company assesses the impairment of long-lived assets, including property and equipment, internally developed software and purchased intangibles subject to amortization, when events or changes in circumstances indicate that the fair value of assets could be less than their net book value. In such event, the Company assesses long-lived assets for impairment by first determining the forecasted, undiscounted cash flows the asset is expected to generate plus the net proceeds expected from the sale of the asset. If this amount is less than the carrying value of the asset, the Company will then determine the fair value of the asset. An impairment loss would be recognized when the fair value is less than the related asset’s net book value, and an impairment expense would be recorded in the amount of the difference. Forecasts of future cash flows are judgments based on the Company’s experience and knowledge of its operations and the industries in which it operates. These forecasts could be significantly affected by future changes in market conditions, the economic environment, including inflation, and purchasing decisions of the Company’s customers.
Income Taxes – Income taxes are accounted for under the asset and liability approach, where deferred tax assets and liabilities are determined based on differences between financial reporting and tax basis of assets and liabilities, and are measured using enacted tax rates and laws that are expected to be in effect when the differences reverse. Valuation allowances are established when necessary to reduce deferred tax assets to the amounts expected to be realized.
The Company accounts for uncertainty in income taxes using a two-step approach to recognizing and measuring uncertain tax positions. The first step is to evaluate the tax position for recognition by determining whether it is more likely than not that the position will be sustained on audit, including resolution of related appeals or litigation processes, if any. The second step is to measure the tax benefit as the largest amount which is more than 50% likely of being realized upon ultimate settlement. An uncertain tax position is considered effectively settled on completion of an examination by a taxing authority if certain other conditions are satisfied. Should the Company incur interest and penalties relating to tax uncertainties, such amounts would be classified as a component of interest expense, net and other income (expense), net, respectively.
Income (Loss) Per Share – Basic income (loss) per share is computed on the basis of the weighted-average number of shares of common stock outstanding during the period. Preferred dividends are deducted from net income (loss) attributed to Pacific Ethanol, Inc. and are considered in the calculation of income (loss) available to common stockholders in computing basic income (loss) per share.
The following tables compute basic and diluted earnings per share (in thousands, except per share data):
| Year Ended December 31, 2014 | ||||||||||||
| Income Numerator | Shares Denominator | Per-Share Amount | ||||||||||
| Net income attributed to Pacific Ethanol | $ | 21,289 | ||||||||||
| Less: Preferred stock dividends | (1,265 | ) | ||||||||||
| Basic income per share: | ||||||||||||
| Income available to common stockholders | $ | 20,024 | 20,810 | $ | 0.96 | |||||||
| Add: Warrants | – | 1,859 | ||||||||||
| Diluted income per share: | ||||||||||||
| Income available to common stockholders | $ | 20,024 | 22,669 | $ | 0.88 | |||||||
| F-15 |
PACIFIC ETHANOL, INC.
NOTES TO CONSOLIDATED FINANCIAL STATEMENTS
| Year Ended December 31, 2013 | ||||||||||||
| Loss Numerator | Shares Denominator | Per-Share Amount | ||||||||||
| Net loss attributed to Pacific Ethanol, Inc. | $ | (781 | ) | |||||||||
| Less: Preferred stock dividends | (1,265 | ) | ||||||||||
| Basic and diluted loss per share: | ||||||||||||
| Loss available to common stockholders | $ | (2,046 | ) | 12,264 | $ | (0.17 | ) | |||||
| Year Ended December 31, 2012 | ||||||||||||
| Loss Numerator | Shares Denominator | Per-Share Amount | ||||||||||
| Net loss attributed to Pacific Ethanol, Inc. | $ | (19,057 | ) | |||||||||
| Less: Preferred stock dividends | (1,268 | ) | ||||||||||
| Basic and diluted loss per share: | ||||||||||||
| Loss available to common stockholders | $ | (20,325 | ) | 7,224 | $ | (2.81 | ) | |||||
There were an aggregate of 660,000, 1,357,000 and 246,000 potentially dilutive shares from convertible securities outstanding as of December 31, 2014, 2013 and 2012, respectively. These convertible securities were not considered in calculating diluted income (loss) per common share for the years ended December 31, 2014, 2013 and 2012 as their effect would be anti-dilutive.
Financial Instruments – The carrying values of cash and cash equivalents, accounts receivable, accounts payable and accrued liabilities are reasonable estimates of their fair values because of the short maturity of these items. The Company recorded at fair value its warrants and conversion features of its convertible notes. The Company believes the carrying value of its long-term debt approximates fair value because the interest rates on these instruments are variable.
Estimates and Assumptions – The preparation of the consolidated financial statements in conformity with GAAP requires management to make estimates and assumptions that affect the reported amounts of assets and liabilities and disclosure of contingent assets and liabilities at the date of the financial statements and the reported amounts of revenues and expenses during the reporting period. Significant estimates are required as part of determining the fair value of warrants and conversion features, allowance for doubtful accounts, estimated lives of property and equipment and intangibles, long-lived asset impairments, valuation allowances on deferred income taxes and the potential outcome of future tax consequences of events recognized in the Company’s financial statements or tax returns. Actual results and outcomes may materially differ from management’s estimates and assumptions.
| F-16 |
PACIFIC ETHANOL, INC.
NOTES TO CONSOLIDATED FINANCIAL STATEMENTS
Subsequent Events – Management evaluates, as of each reporting period, events or transactions that occur after the balance sheet date through the date that the financial statements are issued for either disclosure or adjustment to the consolidated financial results. The Company has evaluated subsequent events up through the date of the filing of this report with the Securities and Exchange Commission.
Reclassifications – Certain prior year amounts have been reclassified to conform to the current presentation. Such reclassification had no effect on the consolidated net income (loss) reported in the consolidated statements of operations.
Recent Accounting Pronouncements – In May 2014, the FASB issued new guidance on the recognition of revenue. The guidance states that an entity should recognize revenue to depict the transfer of promised goods or services to customers in an amount that reflects the consideration to which the entity expects to be entitled in exchange for those goods or services. The standard will be effective for annual reporting periods beginning after December 15, 2016, including interim periods within that reporting period. The Company’s adoption begins with the first fiscal quarter of fiscal year 2017. Early adoption is not permitted. The Company is currently evaluating the impact of the adoption of this accounting standard update on its consolidated results of operations and financial position.
In April 2014, the FASB issued new guidance on the definition of a discontinued operation that requires entities to provide additional disclosures about disposal transactions that do not meet the discontinued operations criteria. The new guidance narrows the focus of discontinued operations to those components that are disposed of or classified as held-for-sale and that represent a strategic shift that has or will have a major impact on the entity’s operations or financial results. The guidance is effective prospectively for all disposals or components initially classified as held-for-sale in periods beginning on or after December 15, 2014. Early adoption is permitted. Upon adoption, the Company does not believe this guidance will have a material impact on its consolidated results of operations or financial position.
In August 2014, the FASB issued new guidance on determining when and how to disclose going-concern uncertainties in the financial statements. The new guidance requires management to perform interim and annual assessments of an entity’s ability to continue as a going concern within one year of the date the financial statements are issued. An entity must provide certain disclosures if conditions or events raise substantial doubt about its ability to continue as a going concern. The guidance is effective for annual periods ending after December 15, 2016 and interim periods thereafter. Early adoption is permitted. Upon adoption, the Company does not believe this guidance will have a material impact on its consolidated results of operations or financial position.
| F-17 |
PACIFIC ETHANOL, INC.
NOTES TO CONSOLIDATED FINANCIAL STATEMENTS
| 2. | PACIFIC ETHANOL PLANTS. |
Consolidation of PE Op Co. – The Company concluded that from PE Op Co.’s inception to the time the Company became a 91% owner, PE Op Co. was a VIE because the other owners of PE Op Co., due to the Company’s involvement through the contractual arrangements discussed below, at all times lacked the power to direct the activities that most significantly impacted PE Op Co.’s economic performance. However, since the Company’s acquisition in December 2013 that brought its ownership interest in PE Op Co. to 91%, the Company has obtained and maintained sufficient control, both by way of agreements as well as based on structural control of PE Op Co., such that PE Op Co. is no longer considered a VIE, and as such the Company consolidates PE Op Co. under the voting rights model. On April 1, 2014, PE Op Co. was converted from a Delaware limited liability company to a Delaware C-corporation and changed its name from New PE Holdco LLC to PE Op Co.
In August 2014, the Company purchased an additional 5% of the ownership interests in PE Op Co. for $6,000,000 in cash, bringing its total ownership interest to 96% as of December 31, 2014.
In January, March, June and December 2013, the Company purchased a 13%, 3%, 2% and 6% of the ownership interests in PE Op Co. for $1,308,000, $331,000, $197,000 and $505,000 in cash, respectively, bringing its total ownership interest to 91% as of December 31, 2013.
At the beginning of the year ended December 31, 2012, the Company had a 34% ownership interest in PE Op Co. In July 2012, the Company purchased an additional 33% ownership interest in PE Op Co. for $20,000,000 by paying $10,000,000 in cash and issuing $10,000,000 in promissory notes.
Because the Company has a controlling financial interest in PE Op Co., it did not record any gain or loss on these purchases, but instead reduced the amount of noncontrolling interest on the consolidated balance sheets by an aggregate of $5,921,000, $14,281,000 and $27,647,000 and recorded the difference of $79,000, $11,940,000 and $7,646,000 for the years ended December 31, 2014, 2013 and 2012, respectively, which represents the fair value of these purchases above the price paid by the Company, to additional paid-in capital on the consolidated balance sheets. Further, in 2014, the Company recorded a deferred tax liability related to its cumulative adjustments to additional paid-in capital of $10,244,000.
The Company’s acquisition of its ownership interest in PE Op Co. does not impact the Company’s rights or obligations under any of the agreements described below. Further, creditors of PE Op Co. or its subsidiaries do not have recourse to the Company. Since its acquisition, the Company has not provided any additional support to PE Op Co. beyond the terms of the agreements described below.
The Company, directly or through one of its subsidiaries, has entered into the management and marketing agreements described below.
Asset Management Agreement – The Company entered into an Asset Management Agreement (“AMA”) with the Plant Owners under which the Company agreed to operate and maintain the Pacific Ethanol Plants on behalf of the Plant Owners. These services generally include, but are not limited to, administering the Plant Owners’ compliance with their credit agreements and performing billing, collection, record keeping and other administrative and ministerial tasks. The Company agreed to supply all labor and personnel required to perform its services under the AMA, including the labor and personnel required to operate and maintain the production facilities.
| F-18 |
PACIFIC ETHANOL, INC.
NOTES TO CONSOLIDATED FINANCIAL STATEMENTS
The costs and expenses associated with the Company’s provision of services under the AMA are prefunded by the Plant Owners under a preapproved budget. The Company’s obligation to provide services is limited to the extent there are sufficient funds advanced by the Plant Owners to cover the associated costs and expenses.
As compensation for providing the services under the AMA, the Company is paid $75,000 per month for each production facility that is operational and $40,000 per month for each production facility that is idled. In addition to the monthly fee, if during any six-month period (measured on September 30 and March 31 of each year commencing March 31, 2011) a production facility has annualized earnings before interest, taxes, depreciation and amortization (“EBITDA”) per gallon of operating capacity of $0.20 or more, the Company will be paid a performance bonus equal to 3% of the increment by which EBITDA exceeds such amount. The aggregate performance bonus for all plants is capped at $2,200,000 for each six-month period. The performance bonus is to be reduced by 25% if all production facilities then operating do not operate at a minimum average yield of 2.70 gallons of denatured ethanol per bushel of corn. In addition, no performance bonus is to be paid if there is a default or event of default under the Plant Owners’ credit agreement resulting from their failure to pay any amounts then due and owing. The AMA also provides the Company with an incentive fee upon any sale of a production facility to the extent the sales price is above $0.60 per gallon of annual capacity. During the year ended December 31, 2014, the Company earned $2,846,000 in respect of such bonuses. These amounts have been eliminated upon consolidation. No bonuses were paid in 2013 and 2012.
The AMA had an initial term of six months and successive six-month renewal periods at the option of the Plant Owners. In addition to typical conditions for a party to terminate the agreement prior to its expiration, the Company may terminate the AMA, and the Plant Owners may terminate the AMA with respect to any facility, at any time by providing at least 60 days prior notice of such termination.
The Company recorded revenues and PE Op Co. recorded costs of approximately $3,530,000, $3,477,000 and $3,180,000 related to the AMA for the years ended December 31, 2014, 2013 and 2012, respectively. As such, these amounts have been eliminated upon consolidation.
Ethanol Marketing Agreements – The Company entered into separate ethanol marketing agreements with each of the Plant Owners, which granted it the exclusive right to purchase, market and sell the ethanol produced at those facilities. Under the terms of the ethanol marketing agreements, within ten days after delivering ethanol to the Company, an amount is paid to the Company equal to (i) the estimated purchase price payable by the third-party purchaser of the ethanol, minus (ii) the estimated amount of transportation costs to be incurred, minus (iii) the estimated incentive fee payable to the Company, which equals 1% of the aggregate third-party purchase price, provided that the marketing fee shall not be less than $0.015 per gallon and not more than $0.0225 per gallon. Each of the ethanol marketing agreements had an initial term of one year and successive one year renewal periods at the option of the individual Plant Owner.
The Company recorded revenues and PE Op Co. recorded costs of approximately $3,986,000, $3,351,000 and $3,157,000 related to the ethanol marketing agreements for the years ended December 31, 2014, 2013 and 2012, respectively. These amounts have been eliminated upon consolidation.
Corn Procurement and Handling Agreements – The Company entered into separate corn procurement and handling agreements with each of the Plant Owners. Under the terms of the corn procurement and handling agreements, each facility appointed the Company as its exclusive agent to solicit, negotiate, enter into and administer, on its behalf, corn supply arrangements to procure the corn necessary to operate its facility. The Company also provides grain handling services including, but not limited to, receiving, unloading and conveying corn into the facility’s storage and, in the case of whole corn delivered, processing and hammering the whole corn.
| F-19 |
PACIFIC ETHANOL, INC.
NOTES TO CONSOLIDATED FINANCIAL STATEMENTS
The Company is to receive a fee of $0.045 per bushel of corn delivered to each facility as consideration for its procurement and handling services, payable monthly. The Company agreed to enter into an agreement guaranteeing the performance of its obligations under the corn procurement and handling agreement upon the request of a Plant Owner. Each corn procurement and handling agreement had an initial term of one year and successive one year renewal periods at the option of the individual Plant Owner.
The Company recorded revenues and PE Op Co. recorded costs of approximately $2,989,000, $2,423,000 and $2,271,000 related to the corn procurement and handling agreements for the years ended December 31, 2014, 2013 and 2012, respectively. These amounts have been eliminated upon consolidation.
Distillers Grains Marketing Agreements – The Company entered into separate distillers grains marketing agreements with each of the Plant Owners, which grant the Company the exclusive right to market, purchase and sell the WDG and corn oil produced at each facility. Under the terms of the distillers grains marketing agreements, within ten days after a Plant Owner delivers WDG or corn oil to the Company, the Plant Owner is paid an amount equal to (i) the estimated purchase price payable by the third-party purchaser of the WDG or corn oil, minus (ii) the estimated amount of transportation costs to be incurred, minus (iii) the estimated amount of fees and taxes payable to governmental authorities in connection with the tonnage of WDG or corn oil produced or marketed, minus (iv) the estimated incentive fee payable to the Company, which equals the greater of (a) 5% of the aggregate third-party purchase price, and (b) $2.00 for each ton of WDG or corn oil sold in the transaction, but not less than $2.00 per ton and not more than $3.50 per ton. Each distillers grains marketing agreement had an initial term of one year and successive one year renewal periods at the option of the individual Plant Owner.
The Company recorded revenues and PE Op Co. recorded costs of approximately $4,788,000, $4,584,000 and $4,353,000 related to the distillers grain marketing agreements for the years ended December 31, 2014, 2013 and 2012, respectively. These amounts have been eliminated upon consolidation.
Assets and Liabilities of PE Op Co. – The carrying values and classification of assets that are collateral for the obligations of PE Op Co. at December 31, 2014 were as follows (in thousands):
| Cash and cash equivalents | $ | 24,287 | ||
| Other current assets | 9,395 | |||
| Property and equipment | 150,281 | |||
| Other assets | 1,312 | |||
| Total assets | $ | 185,275 |
| Current liabilities | $ | 14,023 | ||
| Long-term debt | 58,766 | |||
| Other liabilities | 2,278 | |||
| Total liabilities | $ | 75,067 |
| F-20 |
PACIFIC ETHANOL, INC.
NOTES TO CONSOLIDATED FINANCIAL STATEMENTS
| 3. | PROPERTY AND EQUIPMENT. |
Property and equipment consisted of the following (in thousands):
| December 31, | ||||||||
| 2014 | 2013 | |||||||
| Facilities and plant equipment | $ | 190,714 | $ | 184,064 | ||||
| Land | 2,570 | 2,570 | ||||||
| Other equipment, vehicles and furniture | 7,641 | 5,600 | ||||||
| Construction in progress | 8,720 | 5,007 | ||||||
| 209,645 | 197,241 | |||||||
| Accumulated depreciation | (54,343 | ) | (42,047 | ) | ||||
| $ | 155,302 | $ | 155,194 | |||||
Depreciation expense, including idled facilities, was $12,712,000, $11,662,000 and $11,481,000 for the years ended December 31, 2014, 2013 and 2012, respectively. One of the Pacific Ethanol Plants was idled for four months in 2014 and for all of 2013 and 2012. Depreciation on the Company’s idled assets was an aggregate of $699,000, $2,108,000 and $2,136,000 for the years ended December 31, 2014, 2013 and 2012, respectively.
Included in plant and equipment is $12,829,000 at December 31, 2014 and 2013, attributable to capital leases. Depreciation expense related to these capital leases was $855,000 and $340,000 for the years ended December 31, 2014 and 2013, respectively.
| 4. | INTANGIBLE ASSETS. |
Intangible assets consisted of the following (in thousands):
| Useful | December 31, 2014 | December 31, 2013 | ||||||||||||||||||||||||||
| Life | Accumulated | Net Book | Accumulated | Net Book | ||||||||||||||||||||||||
| (Years) | Gross | Amortization | Value | Gross | Amortization | Value | ||||||||||||||||||||||
| Non-Amortizing: | ||||||||||||||||||||||||||||
| Kinergy tradename | $ | 2,678 | $ | – | $ | 2,678 | $ | 2,678 | $ | – | $ | 2,678 | ||||||||||||||||
| Amortizing: | ||||||||||||||||||||||||||||
| Customer relationships | 10 | 4,741 | (4,633 | ) | 108 | 4,741 | (4,159 | ) | 582 | |||||||||||||||||||
| Total intangible assets, net | $ | 7,419 | $ | (4,633 | ) | $ | 2,786 | $ | 7,419 | $ | (4,159 | ) | $ | 3,260 | ||||||||||||||
Kinergy Tradename – The Company recorded a tradename valued at $2,678,000 in 2006 as part of its acquisition of Kinergy. The Company determined that the Kinergy tradename has an indefinite life and therefore, rather than being amortized, will be tested annually for impairment. The Company did not record any impairment of the Kinergy tradename for the years ended December 31, 2014, 2013 and 2012.
| F-21 |
PACIFIC ETHANOL, INC.
NOTES TO CONSOLIDATED FINANCIAL STATEMENTS
Customer Relationships – The Company recorded customer relationships valued at $4,741,000 as part of its acquisition of Kinergy. The Company has established a useful life of ten years for these customer relationships.
Amortization expense associated with intangible assets totaled $474,000, $474,000 and $724,000 for the years ended December 31, 2014, 2013 and 2012, respectively. The weighted-average unamortized life of the intangible assets is 0.2 years. The remaining expected amortization expense relating to amortizable intangible assets is $108,000 for the year ending December 31, 2015.
| 5. | DERIVATIVES. |
The business and activities of the Company expose it to a variety of market risks, including risks related to changes in commodity prices. The Company monitors and manages these financial exposures as an integral part of its risk management program. This program recognizes the unpredictability of financial markets and seeks to reduce the potentially adverse effects that market volatility could have on operating results.
Commodity Risk – Cash Flow Hedges – The Company uses derivative instruments to protect cash flows from fluctuations caused by volatility in commodity prices for periods of up to twelve months in order to protect gross profit margins from potentially adverse effects of market and price volatility on ethanol sale and purchase commitments where the prices are set at a future date and/or if the contracts specify a floating or index-based price for ethanol. In addition, the Company hedges anticipated sales of ethanol to minimize its exposure to the potentially adverse effects of price volatility. These derivatives may be designated and documented as cash flow hedges and effectiveness is evaluated by assessing the probability of the anticipated transactions and regressing commodity futures prices against the Company’s purchase and sales prices. Ineffectiveness, which is defined as the degree to which the derivative does not offset the underlying exposure, is recognized immediately in cost of goods sold. For the years ended December 31, 2014, 2013 and 2012, the Company did not designate any of its derivatives as cash flow hedges.
Commodity Risk – Non-Designated Hedges – The Company uses derivative instruments to lock in prices for certain amounts of corn and ethanol by entering into forward contracts for those commodities. These derivatives are not designated for special hedge accounting treatment. The changes in fair value of these contracts are recorded on the balance sheet and recognized immediately in cost of goods sold. The Company recognized net losses of $808,000 and $1,821,000, and gains of $999,000 as the change in the fair value of these contracts for the years ended December 31, 2014, 2013 and 2012, respectively.
Non Designated Derivative Instruments – The classification and amounts of the Company’s derivatives not designated as hedging instruments are as follows (in thousands):
| As of December 31, 2014 | ||||||||||||
| Assets | Liabilities | |||||||||||
Type of Instrument | Balance Sheet Location | Fair Value | Balance Sheet Location | Fair Value | ||||||||
| Commodity contracts | Other current assets | $ | 1,586 | Other current liabilities | $ | 1,149 | ||||||
| $ | 1,586 | $ | 1,149 | |||||||||
| F-22 |
PACIFIC ETHANOL, INC.
NOTES TO CONSOLIDATED FINANCIAL STATEMENTS
| As of December 31, 2013 | ||||||||||||
| Assets | Liabilities | |||||||||||
Type of Instrument | Balance Sheet Location | Fair Value | Balance Sheet Location | Fair Value | ||||||||
| Commodity contracts | Other current assets | $ | 961 | Other current liabilities | $ | 859 | ||||||
| $ | 961 | $ | 859 | |||||||||
The classification and amounts of the Company’s recognized gains (losses) for its derivatives not designated as hedging instruments are as follows (in thousands):
| Realized Gains (Losses) | ||||||||||||||
| For the Years Ended December 31, | ||||||||||||||
| Type of Instrument | Statements of Operations Location | 2014 | 2013 | 2012 | ||||||||||
| Commodity contracts | Cost of goods sold | $ | (1,144 | ) | $ | (1,901 | ) | $ | 720 | |||||
| $ | (1,144 | ) | $ | (1,901 | ) | $ | 720 | |||||||
| Unrealized Gains | ||||||||||||||
| For the Years Ended December 31, | ||||||||||||||
| Type of Instrument | Statements of Operations Location | 2014 | 2013 | 2012 | ||||||||||
| Commodity contracts | Cost of goods sold | $ | 336 | $ | 80 | $ | 279 | |||||||
| $ | 336 | $ | 80 | $ | 279 | |||||||||
| 6. | DEBT. |
Long-term borrowings are summarized as follows (in thousands):
| December 31, 2014 | December 31, 2013 | |||||||
| Kinergy operating line of credit | $ | 17,530 | $ | 19,042 | ||||
| Plant Owners’ third-party term debt | 17,003 | 31,678 | ||||||
| Plant Owners’ lines of credit | – | 35,378 | ||||||
| Senior unsecured notes | – | 13,984 | ||||||
| Note payable to related party | – | 750 | ||||||
| 34,533 | 100,832 | |||||||
| Less: Unamortized discount on senior unsecured notes | – | (1,674 | ) | |||||
| 34,533 | 99,158 | |||||||
| Less short-term portion | – | (750 | ) | |||||
| Long-term debt | $ | 34,533 | $ | 98,408 | ||||
| F-23 |
PACIFIC ETHANOL, INC.
NOTES TO CONSOLIDATED FINANCIAL STATEMENTS
Kinergy Line of Credit – Kinergy has an operating line of credit for an aggregate amount of up to $30,000,000. The line of credit matures on December 31, 2016. The credit facility is based on Kinergy’s eligible accounts receivable and inventory levels, subject to certain concentration reserves. The credit facility is subject to certain other sublimits, including inventory loan limits. Interest accrues under the line of credit at a rate equal to (i) the three-month London Interbank Offered Rate (“LIBOR”), plus (ii) a specified applicable margin ranging between 2.00% and 3.00%. The applicable margin was 2.00% at December 31, 2014. The credit facility’s monthly unused line fee is 0.50% of the amount by which the maximum credit under the facility exceeds the average daily principal balance. Payments that may be made by Kinergy to the Company as reimbursement for management and other services provided by the Company to Kinergy are limited under the terms of the credit facility to $1,100,000 per fiscal quarter in 2015.
The credit facility also includes the accounts receivable of PAP as additional collateral. Payments that may be made by PAP to Pacific Ethanol as reimbursement for management and other services provided by Pacific Ethanol to PAP are limited under the terms of the credit facility to the extent that quarterly payments would result in PAP recording less than $100,000 of net income in the quarter.
For the calendar month ended September 30, 2013 and each calendar month thereafter, Kinergy and PAP were collectively required to generate aggregate EBITDA of $450,000 for the three months then ended and aggregate EBITDA of $1,100,000 for the six months then ended. These amounts were required through December 31, 2013. In 2014, the required EBITDA amounts increased to $500,000 for each rolling three month period and $1,300,000 for each rolling six month period. Further, for all monthly periods, Kinergy and PAP must collectively maintain a fixed-charge coverage ratio (calculated as a twelve-month rolling EBITDA divided by the sum of interest expense, capital expenditures, principal payments of indebtedness, indebtedness from capital leases and taxes paid during such twelve-month rolling period) of at least 2.0 and are prohibited from incurring any additional indebtedness (other than specific intercompany indebtedness) or making any capital expenditures in excess of $100,000 absent the lender’s prior consent. In December 2014, the terms of the above covenants were changed such that if the Company’s monthly average unused availability is in excess of $10,000,000 and Kinergy maintains at least $6,000,000 in excess availability during the quarter, that month’s EBITDA and fixed-charge coverage ratio covenants are not required to be met. The Company believes it is in compliance with these covenants.
Kinergy and PAP’s obligations under the credit facility are secured by a first-priority security interest in all of their assets in favor of the lender. Pacific Ethanol has guaranteed all of Kinergy’s obligations under the line of credit. As of December 31, 2014, Kinergy had an available borrowing base under the credit facility of $30,000,000 and an outstanding balance of $17,530,000.
Plant Owners’ Term Debt and Operating Lines of Credit – The Plant Owners’ debt as of December 31, 2014 consisted of a $32,487,000 tranche A-1 term loan, a $26,279,000 tranche A-2 term loan and a $35,378,000 revolving credit facility, which was subsequently reduced to $19,473,000, all of which have a maturity date of June 30, 2016. Pacific Ethanol holds a combined $41,763,000 of these term loans, which are eliminated in consolidation. As of December 31, 2014, the combined outstanding balance of these loans was $17,003,000 on a consolidated basis (net of Pacific Ethanol purchases).
| F-24 |
PACIFIC ETHANOL, INC.
NOTES TO CONSOLIDATED FINANCIAL STATEMENTS
The term and revolving debt require monthly interest payments at a floating rate equal to the three-month LIBOR or the Prime Rate of interest, at the Plant Owners’ election, plus 10.0%. At December 31, 2014, the interest rate was approximately 13.25%. Repayments of principal are based on available free cash flow of the Plant Owners, until maturity, when all principal amounts are due.
Monthly interest payments due to certain lenders on both the term and revolving debt was deferred and added to the principal amount of the loans. As of December 31, 2014 and 2013, the extended principal balances above included $0 and $7,487,000 of accrued interest that was deferred by the Plant Owners, respectively.
As of December 31, 2014, the unused availability under this line of credit was $19,473,000.
Acquisitions of Plant Debt – On January 11, 2013, the Company used $21,500,000 of the proceeds of the January 2013 Financing Transaction to purchase from certain lenders an aggregate amount of $21,500,000 of the Plant Owners’ tranche A-2 term loans. The Company determined that the acquisition of the plant debt was a modification of terms because the lenders who held the acquired plant debt were the lenders under the January 2013 Notes. Based on the Company’s review of the present value of cash flows of the January 2013 Notes compared to the older plant debt, which resulted in a less than 10% change, the modification was not significant and the Company did not record a gain or loss associated with the modification. The Company expensed certain legal costs associated with the debt modification of approximately $408,000, rather than amortizing those expenses over the life of the debt. Because the plant debt acquired is now held by Pacific Ethanol, this specific debt is eliminated in consolidation.
On March 28, 2013, the Company used proceeds from the issuance of its Series A Notes and warrants to purchase $3,500,000 of revolving credit facility debt, at par, from a lender. Under the terms of the amended credit facility, the Company was obligated to immediately forgive the purchased amount of revolving credit facility debt and has permanently reduced the maximum commitment on this facility to $36,500,000.
On March 28, 2013, the Company also used proceeds from the issuance of its Series A Notes and warrants to purchase $2,636,000 of tranche A-2 term loans and an additional 3% ownership interest in PE Op Co. for a combined purchase price of $2,150,000. The Company first allocated $331,000 of this payment to the PE Op Co. ownership interest and the remainder was allocated to the tranche A-2 term loans. The $817,000 difference between the amount the Company allocated to the term loans and the face amount of $2,636,000 was recorded as a gain on extinguishment of debt.
On June 21, 2013, the Company used proceeds from the issuance of its Series B Notes to purchase $1,122,000 of revolving credit facility debt at a discount. Under the terms of the amended credit facility, the Company was obligated to immediately forgive the purchased amount of revolving credit facility debt and has permanently reduced the maximum commitment on this facility to $35,378,000.
On June 21, 2013, the Company also used proceeds from the issuance of its Series B Notes to purchase $2,907,000 of tranche A-1 and A-2 term loans at a discount and an additional 2% ownership interest in PE Op Co. for $197,000. The Company recorded a gain on extinguishment of debt of $998,000 related to the discount it paid for the revolving and term loans.
| F-25 |
PACIFIC ETHANOL, INC.
NOTES TO CONSOLIDATED FINANCIAL STATEMENTS
On June 6, 2014, the Company purchased $14,675,000 of term debt for $17,038,000 in cash, reducing its consolidated plant term debt by $14,675,000, and recorded a $2,363,000 loss on extinguishment of debt for the amount paid in excess of the principal balance.
As of December 31, 2014, the Company held an aggregate of $41,763,000 of the tranche A-1 and tranche A-2 term loans, which has been eliminated upon consolidation.
Additional Plant Operating Line of Credit – The Plant Owners have an additional revolving credit facility for up to an additional $15,000,000, with a maturity date of June 25, 2015. The Plant Owners have the right at any time, and from time to time, but subject to limitations imposed by an intercreditor agreement, to prepay in whole or in part the revolving loans and tranche A-1 loans (and the tranche A-2 loans following the payment in full of the revolving loans and tranche A-1 loans). However, in the event of any prepayment of the tranche A-1 loans that have a maturity date of June 30, 2016, the Plant Owners must pay a premium equal to the present value of all interest payments that would have accrued from the date of such payment through June 30, 2016, calculated using a discount rate, applied quarterly, equal to the Treasury Rate as of such prepayment date plus 50 basis points. The credit agreement also provides for mandatory prepayments in connection with certain customary events, including any sale of material assets; however, certain mandatory prepayments are not subject to the prepayment premium. At December 31, 2014, the interest rate was approximately 8.75% and the Plant Owners had unused availability under the new revolving credit facility of $15,000,000.
All of the term loans and revolving credit facilities represent permanent financing and are secured by a perfected, first-priority security interest in substantially all of the assets, including inventories and all rights, title and interest in all tangible and intangible assets, of the Plant Owners. The Plant Owners’ creditors do not have recourse to Pacific Ethanol.
Senior Unsecured Notes – On January 11, 2013, under the terms of a securities purchase agreement dated December 19, 2012 among the Company and five accredited investors, the Company issued and sold to the investors in a private offering $22,192,000 in aggregate principal amount of its senior unsecured notes (“January 2013 Notes”) and warrants to purchase an aggregate of 1,708,700 shares of the Company’s common stock (“January 2013 Financing Transaction”) for aggregate net proceeds of $22,072,000. The warrants have an exercise price of $6.32 per share and expire in January 2018. The January 2013 Notes had an original maturity date of March 30, 2016 and bore interest at a rate of 5% per annum, subject to adjustment. Payments due under the January 2013 Notes ranked senior to all other indebtedness of the Company and its subsidiaries, other than certain permitted senior indebtedness.
Upon closing of the January 2013 Financing Transaction, the Company recorded a debt discount of $2,657,000 associated with the value of the warrants issued in connection with the financing. The debt discount will be amortized over the life of the January 2013 Notes to approximate a yield adjustment.
If at any time the Company were to receive net cash proceeds from an issuance of equity or equity-linked securities of the Company, interest received from any purchased and outstanding Plant Owners’ term debt, certain sales of assets or as a result of incurring certain indebtedness, then the Company would be obligated to prepay the January 2013 Notes using 100% of all such net cash proceeds, provided that any net proceeds received in connection with an equity-linked issuance must be used to either prepay the January 2013 Notes or purchase certain outstanding debt issued by the Plant Owners.
| F-26 |
PACIFIC ETHANOL, INC.
NOTES TO CONSOLIDATED FINANCIAL STATEMENTS
During 2014, the Company made principal cash payments on the January 2013 Notes in the aggregate amount of $13,984,000, fully retiring the debt prior to maturity. During 2013, the Company made principal cash payments on the January 2013 Notes in the aggregate amount of $6,208,000 and the Company issued 500,000 shares of its common stock as a $2,000,000 principal payment, resulting in a loss of $229,000 on extinguishment of debt.
Subordinated Convertible Notes – On March 28, 2013, the Company issued $6,000,000 in aggregate principal amount of its Series A Subordinated Convertible Notes (“Series A Notes”), and warrants to purchase an aggregate of 1,839,600 shares of common stock for aggregate gross proceeds of $6,000,000. On June 21, 2013, the Company issued $8,000,000 in aggregate principal amount of its Series B Subordinated Convertible Notes (“Series B Notes”) for aggregate gross proceeds of $8,000,000. The warrants had an exercise price of $7.59 per share. Of the warrants issued in the transaction, warrants to purchase 788,400 shares of common stock expired in March 2015 and warrants to purchase 1,051,200 shares of common stock expired in June 2015. The net proceeds of these offerings of $12,560,000 were used to (i) purchase $6,665,000 of the Plant Owners’ debt maturing in June 2013, the maturity of which was also extended at the time from June 2013 to June 2016, and of which the Company immediately retired $1,122,000; (ii) acquire an additional 5% ownership interest in PE Op Co.; and (iii) purchase and immediately retire an additional $3,500,000 of the Plant Owners’ term debt.
Unless converted or redeemed earlier, the Series A and B Notes were to mature on March 28, 2014. The Series A and B Notes bore interest at 5% per annum, compounded monthly. All amounts due under the Series A and B Notes were convertible at any time, in whole or in part, at the option of the holders into shares of the Company’s common stock at a conversion price (“Fixed Conversion Price”), which was subject to adjustment as described below.
The Series A and B Notes were initially convertible into shares of the Company’s common stock at the initial Fixed Conversion Price of $15.00 per share. If the Company sold or issued any securities with “floating” conversion prices based on the market price of its common stock, the holder of a Series A or B Note would have the right thereafter to substitute the “floating” conversion price for the Fixed Conversion Price upon conversion of all or part of the Series A or B Note.
The Company determined that the conversion feature of the Series A and B Notes and the related warrants require bifurcation and liability classification and measurement, at fair value, and require evaluation at each reporting period. The initial fair values of the conversion feature of the Series A Notes of $1,400,800 and the warrants of $882,500 were accounted for as a debt discount and were amortized into interest expense as a yield adjustment over the term of the Series A Notes. The initial fair values of the conversion feature of the Series B Notes of $2,928,500 and the warrants of $689,300 were accounted for as a debt discount and were amortized into interest expense as a yield adjustment over the term of the Series B Notes.
In 2013, the Company made installment payments and processed a number of conversions. In the aggregate, the Company issued 4,446,000 shares of its common stock in payment of principal and interest in an aggregate amount of the $14,000,000 in respect of the Series A and B Notes. In connection with these installment payments and conversions, the Company recorded losses on extinguishments of debt of $4,621,000 for the year ended December 31, 2013.
As of December 31, 2013, the Series A and B Notes had been fully retired.
| F-27 |
PACIFIC ETHANOL, INC.
NOTES TO CONSOLIDATED FINANCIAL STATEMENTS
Note Payable to Related Party – The Company had a note payable to its Chief Executive Officer totaling $750,000 as of December 31, 2013. Interest on the unpaid principal amount accrues at a rate of 8.00% per annum. The Company recorded interest expense for this note of approximately $14,795 for the year ended December 31, 2014 and $60,000 for each of the years ended December 31, 2013 and 2012. On March 31, 2014, the Company paid in cash the outstanding balance of the note payable.
Interest Expense on Borrowings and Maturities – Interest expense on all borrowings discussed above was $6,546,000, $12,680,000 and $12,314,000 for the years ended December 31, 2014, 2013 and 2012, respectively. The consolidated long-term debt of $34,533,000, is due in 2016.
| 7. | INCOME TAXES. |
The asset and liability method is used to account for income taxes. Under this method, deferred tax assets and liabilities are recognized for tax credits and for the future tax consequences attributable to differences between the financial statement carrying amounts of existing assets and liabilities and their tax bases. Deferred tax assets and liabilities are measured using enacted tax rates expected to apply to taxable income in the years in which those temporary differences are expected to be recovered or settled. A valuation allowance is recorded to reduce the carrying amounts of deferred tax assets unless it is more likely than not that those assets will be realized.
The Company files a consolidated federal income tax return. This return includes all entities 80% or more owned by the Company as well as the Company’s pro-rata share of taxable income from pass-through entities in which the Company holds an ownership interest. State tax returns are filed on a consolidated, combined or separate basis depending on the applicable laws relating to the Company and its subsidiaries.
The Company recorded a provision for income taxes for the year ended December 31, 2014 of $15,137,000. The Company recorded no provision for income taxes for the years ended December 31, 2013 and 2012.
A reconciliation of the differences between the United States statutory federal income tax rate and the effective tax rate as provided in the consolidated statements of operations is as follows:
| Years Ended December 31, | ||||||||||||
| 2014 | 2013 | 2012 | ||||||||||
| Statutory rate | 35.0 | % | 35.0 | % | 35.0 | % | ||||||
| Change in valuation allowance | (11.5 | ) | 458.0 | 125.5 | ||||||||
| Convertible debt instruments | – | (297.7 | ) | – | ||||||||
| Section 382 reduction to loss carryover | (24.2 | ) | (141.1 | ) | (169.4 | ) | ||||||
| State income taxes, net of federal benefit | 10.0 | (8.2 | ) | 5.5 | ||||||||
| Stock compensation | – | (20.9 | ) | (1.9 | ) | |||||||
| Change in tax status of PE Op Co. | (1.6 | ) | – | – | ||||||||
| Fair value adjustments and warrant inducements | 31.8 | – | – | |||||||||
| Domestic production gross receipts deduction | (2.0 | ) | – | – | ||||||||
| Non-deductible items | 0.6 | (27.7 | ) | 3.6 | ||||||||
| Other | (1.3 | ) | 2.6 | 1.7 | ||||||||
| Effective rate | 36.8 | % | 0.0 | % | 0.0 | % | ||||||
| F-28 |
PACIFIC ETHANOL, INC.
NOTES TO CONSOLIDATED FINANCIAL STATEMENTS
Deferred income taxes are provided using the asset and liability method to reflect temporary differences between the financial statement carrying amounts and the tax bases of assets and liabilities using presently enacted tax rates and laws. The components of deferred income taxes included in the consolidated balance sheets were as follows (in thousands):
| December 31, | ||||||||
| 2014 | 2013 | |||||||
| Deferred tax assets: | ||||||||
| Net operating loss carryforwards | $ | 12,385 | $ | 17,566 | ||||
| Capital loss carryover | – | 844 | ||||||
| Stock-based compensation | 781 | 556 | ||||||
| Enterprise zone credits | – | 259 | ||||||
| Other accrued liabilities | 483 | 395 | ||||||
| Convertible debt | 669 | – | ||||||
| Fixed assets | – | 119 | ||||||
| Inventory | 575 | – | ||||||
| Other | 217 | 217 | ||||||
| Total deferred tax assets | 15,110 | 19,956 | ||||||
| Deferred tax liabilities: | ||||||||
| Fixed assets | (24,813 | ) | – | |||||
| Investment in PE Op Co. | – | (11,074 | ) | |||||
| Intangibles | (1,134 | ) | (1,325 | ) | ||||
| Derivative instruments | (172 | ) | (226 | ) | ||||
| Other | (278 | ) | – | |||||
| Total deferred tax liabilities | (26,397 | ) | (12,625 | ) | ||||
| Valuation allowance | (4,147 | ) | (8,422 | ) | ||||
| Net deferred tax liabilities | $ | (15,434 | ) | $ | (1,091 | ) | ||
| Classified in balance sheet as: | ||||||||
| Other current assets | $ | 1,606 | $ | – | ||||
| Deferred tax liabilities | (17,040 | ) | (1,091 | ) | ||||
| $ | (15,434 | ) | $ | (1,091 | ) | |||
A portion of the Company’s net operating loss carryforwards will be subject to provisions of the tax law that limit the use of losses incurred by a company prior to the date certain ownership changes occur. All of the Company’s net operating loss carryforwards are subject to these limitations at December 31, 2014.
Due to the limitation, a significant portion of these net operating loss carryforwards will expire regardless of whether the Company generates future taxable income. After reducing these net operating loss carryforwards for the amount which will expire, the Company had federal net operating loss carryforwards of approximately $28,321,000 and $45,250,000, and state net operating loss carryforwards of approximately $58,990,000 and $41,695,000, at December 31, 2014 and 2013, respectively. These net operating loss carryforwards expire at various dates beginning in 2015.
In assessing whether the deferred tax assets are realizable, a more likely than not standard is applied. If it is determined that it is more likely than not that deferred tax assets will not be realized, a valuation allowance must be established against the deferred tax assets. The ultimate realization of deferred tax assets is dependent upon the generation of future taxable income during the periods in which the associated temporary differences become deductible. Management considers the scheduled reversal of deferred tax liabilities, projected future taxable income and tax planning strategies in making this assessment.
| F-29 |
PACIFIC ETHANOL, INC.
NOTES TO CONSOLIDATED FINANCIAL STATEMENTS
A valuation allowance has been established in the amount of $4,147,000 and $8,422,000 at December 31, 2014 and 2013, respectively, based on the Company’s assessment of the future realizability of certain deferred tax assets. For the years ended December 31, 2014 and 2013, the Company recorded a decrease in the valuation allowance of $4,275,000 and $3,133,000, respectively, attributable almost exclusively to the expected expiration of net operating loss carryforwards due to limitations caused by ownership changes as previously discussed. The valuation allowance on deferred tax assets is related to future deductible temporary differences and net operating loss carryforwards (exclusive of net operating losses associated with items recorded directly to equity) for which the Company has concluded it is more likely than not that these items will not be realized in the ordinary course of operations.
At December 31, 2014, the Company had no increase or decrease in unrecognized income tax benefits for the year as a result of uncertain tax positions taken in a prior or current period. There was no accrued interest or penalties relating to tax uncertainties at December 31, 2014. Unrecognized tax benefits are not expected to increase or decrease within the next twelve months.
The Company is subject to income tax in the United States federal jurisdiction and various state jurisdictions and has identified its federal tax return and tax returns in state jurisdictions below as “major” tax filings. These jurisdictions, along with the years still open to audit under the applicable statutes of limitation, are as follows:
| Jurisdiction | Tax Years | |
| Federal | 2011 – 2013 | |
| Arizona | 2011 – 2013 | |
| California | 2010 – 2013 | |
| Colorado | 2010 – 2013 | |
| Idaho | 2011 – 2013 | |
| Oregon | 2011 – 2013 |
However, because the Company had net operating losses and credits carried forward in several of the jurisdictions, including the United States federal and California jurisdictions, certain items attributable to closed tax years are still subject to adjustment by applicable taxing authorities through an adjustment to tax attributes carried forward to open years.
| 8. | PREFERRED STOCK. |
The Company has 6,734,835 undesignated shares of authorized and unissued preferred stock, which may be designated and issued in the future on the authority of the Company’s Board of Directors. As of December 31, 2013, the Company had the following designated preferred stock:
Series A Preferred Stock – The Company has authorized 1,684,375 shares of Series A Cumulative Redeemable Convertible Preferred Stock (“Series A Preferred Stock”), with none outstanding at December 31, 2014 and 2013. Shares of Series A Preferred Stock that are converted into shares of the Company’s common stock revert to undesignated shares of authorized and unissued preferred stock.
| F-30 |
PACIFIC ETHANOL, INC.
NOTES TO CONSOLIDATED FINANCIAL STATEMENTS
Upon any issuance, the Series A Preferred Stock would rank senior in liquidation and dividend preferences to the Company’s common stock. Holders of Series A Preferred Stock would be entitled to quarterly cumulative dividends payable in arrears in cash in an amount equal to 5% per annum of the purchase price per share of the Series A Preferred Stock. The holders of the Series A Preferred Stock would have conversion rights initially equivalent to two shares of common stock for each share of Series A Preferred Stock, subject to customary antidilution adjustments. Certain specified issuances will not result in antidilution adjustments. The shares of Series A Preferred Stock would also be subject to forced conversion upon the occurrence of a transaction that would result in an internal rate of return to the holders of the Series A Preferred Stock of 25% or more. Accrued but unpaid dividends on the Series A Preferred Stock are to be paid in cash upon any conversion of the Series A Preferred Stock.
The holders of Series A Preferred Stock would have a liquidation preference over the holders of the Company’s common stock equivalent to the purchase price per share of the Series A Preferred Stock plus any accrued and unpaid dividends on the Series A Preferred Stock. A liquidation would be deemed to occur upon the happening of customary events, including transfer of all or substantially all of the Company’s capital stock or assets or a merger, consolidation, share exchange, reorganization or other transaction or series of related transactions, unless holders of 66 2/3% of the Series A Preferred Stock vote affirmatively in favor of or otherwise consent to such transaction.
Series B Preferred Stock – The Company has authorized 1,580,790 shares of Series B Cumulative Convertible Preferred Stock (“Series B Preferred Stock”), with 926,942 shares outstanding at December 31, 2014 and 2013. Shares of Series B Preferred Stock that are converted into shares of the Company’s common stock revert to undesignated shares of authorized and unissued preferred stock.
The Series B Preferred Stock ranks senior in liquidation and dividend preferences to the Company’s common stock. Holders of Series B Preferred Stock are entitled to quarterly cumulative dividends payable in arrears in cash in an amount equal to 7.00% per annum of the purchase price per share of the Series B Preferred Stock; however, subject to the provisions of the Letter Agreement described below, such dividends may, at the option of the Company, be paid in additional shares of Series B Preferred Stock based initially on the liquidation value of the Series B Preferred Stock. The holders of Series B Preferred Stock have a liquidation preference over the holders of the Company’s common stock initially equivalent to $19.50 per share of the Series B Preferred Stock plus any accrued and unpaid dividends on the Series B Preferred Stock. A liquidation will be deemed to occur upon the happening of customary events, including the transfer of all or substantially all of the capital stock or assets of the Company or a merger, consolidation, share exchange, reorganization or other transaction or series of related transaction, unless holders of 66 2/3% of the Series B Preferred Stock vote affirmatively in favor of or otherwise consent that such transaction shall not be treated as a liquidation. The Company believes that such liquidation events are within its control and therefore has classified the Series B Preferred Stock in stockholders’ equity.
The holders of the Series B Preferred Stock have conversion rights initially equivalent to approximately 0.03 shares of common stock for each share of Series B Preferred Stock. The conversion ratio is subject to customary antidilution adjustments. In addition, antidilution adjustments are to occur in the event that the Company issues equity securities, including derivative securities convertible into equity securities (on an as-converted or as-exercised basis), at a price less than the conversion price then in effect. The shares of Series B Preferred Stock are also subject to forced conversion upon the occurrence of a transaction that would result in an internal rate of return to the holders of the Series B Preferred Stock of 25% or more. The forced conversion is to be based upon the conversion ratio as last adjusted. Accrued but unpaid dividends on the Series B Preferred Stock are to be paid in cash upon any conversion of the Series B Preferred Stock.
| F-31 |
PACIFIC ETHANOL, INC.
NOTES TO CONSOLIDATED FINANCIAL STATEMENTS
The holders of Series B Preferred Stock vote together as a single class with the holders of the Company’s common stock on all actions to be taken by the Company’s stockholders. Each share of Series B Preferred Stock entitles the holder to approximately 0.03 votes per share on all matters to be voted on by the stockholders of the Company. Notwithstanding the foregoing, the holders of Series B Preferred Stock are afforded numerous customary protective provisions with respect to certain actions that may only be approved by holders of a majority of the shares of Series B Preferred Stock.
In 2008, the Company entered into Letter Agreements with Lyles United LLC (“Lyles United”) and other purchasers under which the Company expressly waived its rights under the Certificate of Designations relating to the Series B Preferred Stock to make dividend payments in additional shares of Series B Preferred Stock in lieu of cash dividend payments without the prior written consent of Lyles United and the other purchasers.
Registration Rights Agreement – In connection with the sale of its Series B Preferred Stock, the Company entered into a registration rights agreement with Lyles United. The registration rights agreement is to be effective until the holders of the Series B Preferred Stock, and their affiliates, as a group, own less than 10% for each of the series issued, including common stock into which such Series B Preferred Stock has been converted. The registration rights agreement provides that holders of a majority of the Series B Preferred Stock, including common stock into which such Series B Preferred Stock has been converted, may demand and cause the Company to register on their behalf the shares of common stock issued, issuable or that may be issuable upon conversion of the Preferred Stock and as payment of dividends thereon, and upon exercise of the related warrants (collectively, the “Registrable Securities”). The Company is required to keep such registration statement effective until such time as all of the Registrable Securities are sold or until such holders may avail themselves of Rule 144 for sales of Registrable Securities without registration under the Securities Act of 1933, as amended. The holders are entitled to two demand registrations on Form S-1 and unlimited demand registrations on Form S-3; provided, however, that the Company is not obligated to effect more than one demand registration on Form S-3 in any calendar year. In addition to the demand registration rights afforded the holders under the registration rights agreement, the holders are entitled to unlimited “piggyback” registration rights. These rights entitle the holders who so elect to be included in registration statements to be filed by the Company with respect to other registrations of equity securities. The Company is responsible for all costs of registration, plus reasonable fees of one legal counsel for the holders, which fees are not to exceed $25,000 per registration. The registration rights agreement includes customary representations and warranties on the part of both the Company and the holders and other customary terms and conditions.
The Company recorded preferred stock dividends of $1,265,000, $1,265,000 and $1,268,000 for the years ended December 31, 2014, 2013 and 2012, respectively. For the years ended December 31, 2011, 2010 and 2009, the Company accrued but did not pay any preferred stock dividends. For the years ended December 31, 2014, 2013 and 2012, however, the Company accrued and paid all dividends in cash.
| F-32 |
PACIFIC ETHANOL, INC.
NOTES TO CONSOLIDATED FINANCIAL STATEMENTS
Beginning in 2012, the Company has entered into a series of agreements with the parties to whom unpaid dividends were owed under which the Company issued shares of its common stock in satisfaction of a portion of the accrued and unpaid dividends. In connection with each payment of accrued and unpaid dividends, the payees agreed to forebear for a term from exercising any rights they may have with the respect to accrued and unpaid dividends. In 2014, the Company paid the last two installments in cash. The following table summarizes the details of the Company’s payments to the holders of its Series B Preferred Stock:
| Agreement/Payment Date | Amount of Dividends Paid | Shares of Common Stock Issued | Extended Forbearance Date | |||||||||||
| August 12, 2012 | $ | 732,000 | 157,000 | January 1, 2014 | ||||||||||
| December 26, 2012 | 732,000 | 144,500 | June 30, 2014 | |||||||||||
| March 27, 2013 | 732,000 | 139,000 | September 30, 2014 | |||||||||||
| July 26, 2013 | 731,000 | 175,000 | December 31, 2014 | |||||||||||
| September 17, 2013 | 731,000 | 197,000 | March 31, 2015 | |||||||||||
| May 23, 2014 | 1,463,000 | 120,000 | November 30, 2015 | |||||||||||
| November 24, 2014 | 1,000,000 | – | ||||||||||||
| December 23, 2014 | 1,194,000 | – | ||||||||||||
| Total | $ | 7,315,000 | 932,500 | |||||||||||
| 9. | COMMON STOCK AND WARRANTS. |
The following table summarizes warrant activity for the years ended December 31, 2014, 2013 and 2012 (number of shares in thousands):
| Number of Shares | Price per Share | Weighted Average Exercise Price | ||||||||||
| Balance at December 31, 2011 | 426 | $1.80 – $745.50 | $ | 117.60 | ||||||||
| Warrants issued | 4,633 | $6.45 – $8.85 | $ | 7.80 | ||||||||
| Warrants exercised | (20 | ) | $1.80 – $7.95 | $ | 2.85 | |||||||
| Balance at December 31, 2012 | 5,039 | $1.80 – $745.50 | $ | 17.10 | ||||||||
| Warrants issued | 3,548 | $6.32 – $7.59 | $ | 6.98 | ||||||||
| Warrants exercised | (285 | ) | $1.80 – $8.85 | $ | 7.27 | |||||||
| Warrants expired | (27 | ) | $745.50 | $ | 745.50 | |||||||
| Balance at December 31, 2013 | 8,275 | $5.47 – $735.00 | $ | 10.04 | ||||||||
| Warrants exercised | (6,615 | ) | $6.09 – $8.85 | $ | 7.17 | |||||||
| Warrants expired | (804 | ) | $5.47 | $ | 5.47 | |||||||
| Balance at December 31, 2014 | 856 | $6.09 – $735.00 | $ | 36.55 | ||||||||
January 2013 Financing – In connection with the January 2013 Financing Transaction, the Company issued warrants to purchase an aggregate of 1,708,700 shares of common stock. All of the warrants were exercised in 2014.
Series A and B Notes – In connection with the Company’s issuance of its Series A and B Notes, the Company issued warrants to purchase up to 788,400 and 1,051,200 shares of common stock, respectively. All of the warrants were exercised in 2014.
| F-33 |
PACIFIC ETHANOL, INC.
NOTES TO CONSOLIDATED FINANCIAL STATEMENTS
September 2012 Public Offering – On September 26, 2012, the Company raised $10,091,000, net of $909,000 of underwriting fees and issuance costs, through a public offering of units consisting of an aggregate of 1,833,000 shares of common stock and warrants immediately exercisable to purchase an aggregate of 1,833,000 shares of common stock at an exercise price of $8.85 per share and which expire in September 2015. The Company accounted for the net proceeds of the offering by first allocating the $1,658,000 fair value of the warrants to liabilities and then allocating the remaining amount to equity. As of December 31, 2014, warrants to purchase 473,000 shares of common stock remained outstanding.
July 2012 Public Offering – On July 3, 2012, the Company raised $10,903,000, net of $1,137,000 of underwriting fees and issuance costs, through a public offering of units consisting of an aggregate of 1,867,000 shares of common stock, warrants immediately exercisable to purchase an aggregate of 1,867,000 shares of common stock at an exercise price of $9.45 per share and which expire in 2017 (“Series I Warrants”) and warrants immediately exercisable to purchase an aggregate of 933,000 shares of common stock at an exercise price of $7.95 per share and which expire in 2014 (“Series II Warrants”). The Series I Warrants and the Series II Warrants are subject to “weighted-average” anti-dilution adjustments if the Company issues or is deemed to have issued securities at a price lower than their then applicable exercise prices. Due to subsequent transactions, the exercise price of the Series I Warrants was reduced to $6.09 per share and the exercise price of the Series II Warrants was reduced to $5.47 per share. The Company accounted for the net proceeds of the offering by first allocating the $3,380,000 fair value of the warrants to liabilities and then allocating the remaining amount to equity. The Series II Warrants expired unexercised. As of December 31, 2014, Series I Warrants to purchase 211,000 shares of common stock remained outstanding.
Warrant Inducements – During 2014 and 2013, certain holders exercised warrants and received payments from the Company in the aggregate amounts of $2,271,000 and $785,800, respectively, in cash as an inducement for these exercises, which were recorded as an expense.
Warrant Terms – The exercise prices of the warrants described above are subject to adjustment for stock splits, combinations or similar events, and, in such event, the number of shares issuable upon the exercise of the warrants will also be adjusted so that the aggregate exercise price shall be the same immediately before and immediately after the adjustment. The warrants generally require payments to be made by the Company for failure to deliver the shares of common stock issuable upon exercise. The warrants may not be exercised if, after giving effect to the exercise, the investor together with its affiliates would beneficially own in excess of 4.99% of the Company’s outstanding shares of common stock. The blocker applicable to the exercise of the warrants may be raised or lowered to any other percentage not in excess of 9.99%, except that any increase will only be effective upon 61-days’ prior notice to the Company. If the Company issues options, convertible securities, warrants, stock, or similar securities to holders of its common stock generally, each holder of certain warrants has the right to acquire the same securities as if the holder had exercised its warrants. The warrants prohibit the Company from entering into specified transactions involving a change of control, unless the successor entity assumes all of the Company’s obligations under the warrants under a written agreement before the transaction is completed. When there is a transaction involving a permitted change of control, a holder of a warrant will have the right to force the Company to repurchase the holder’s warrant for a purchase price in cash equal to the Black-Scholes value (as calculated under the individual warrant agreements) of the then unexercised portion of the warrant.
Accounting for Warrants – The Company has determined that the warrants issued in the above transactions did not meet the conditions for classification in stockholders’ equity and as such, the Company has recorded them as a liability at fair value. The Company will revalue them at each reporting period. Further, as noted above, certain of the exercise prices declined as a result of the anti-dilution adjustments due to subsequent transactions. Accordingly, the Company recorded fair value adjustments quarterly, with total fair value adjustments of $35,260,000, $648,000 and $1,954,000 for the years ended December 31, 2014, 2013 and 2012, respectively, which is largely attributed to adjustment, if any, to their exercise prices, term shortening and changes in the market value of the Company’s common stock. See Note 12 for the Company’s fair value assumptions.
| F-34 |
PACIFIC ETHANOL, INC.
NOTES TO CONSOLIDATED FINANCIAL STATEMENTS
Registration Rights Agreements – In connection with the above issuances, the Company entered into a registration rights agreements with all of the investors to file registration statements on Form S-1 or S-3 with the Securities and Exchange Commission by certain dates for the resale by the purchasers of the shares of common stock issued and the shares of common stock issuable upon exercise of the warrants. Subject to customary grace periods, the Company is required to keep the registration statements (and the accompanying prospectuses) available for use for resale by the investors on a delayed or continuous basis at then-prevailing market prices at all times until the earlier of (i) the date as of which all of the investors may sell all of the shares of common stock required to be covered by the registration statement without restriction under Rule 144 under the Securities Act of 1933, as amended (including volume restrictions) and without the need for current public information required by Rule 144(c)(1), if applicable) or (ii) the date on which the investors have sold all of the shares of common stock covered by the registration statement. The Company must pay registration delay payments of up to 2% of each investor’s initial investment per month if the registration statement ceases to be effective prior to the expiration of deadlines provided for in the registration rights agreement. The initial registration statements became effective by the stated deadlines and the Company did not record any liability associated with any registration delay payments under the registration rights agreements.
| 10. | STOCK-BASED COMPENSATION. |
The Company has two equity incentive compensation plans: a 2004 Stock Option Plan and a 2006 Stock Incentive Plan.
2004 Stock Option Plan – The 2004 Stock Option Plan authorized the issuance of incentive stock options (“ISOs”) and non-qualified stock options (“NQOs”) to the Company’s officers, directors or key employees or to consultants that do business with the Company for up to an aggregate of 23,810 shares of common stock. On September 7, 2006, the Company terminated the 2004 Stock Option Plan, except to the extent of issued and outstanding options then existing under the plan. The Company had options outstanding to purchase 762 shares of common stock under its 2004 Stock Option Plan at December 31, 2014 and 2013.
2006 Stock Incentive Plan – The 2006 Stock Incentive Plan authorizes the issuance of ISOs, NQOs, restricted stock, restricted stock units, stock appreciation rights, direct stock issuances and other stock-based awards to the Company’s officers, directors or key employees or to consultants that do business with the Company for up to an aggregate of 1,715,000 shares of common stock.
Stock Options – On August 1, 2011, August 25, 2011 and June 18, 2013, the Company granted options to purchase an aggregate of 12,900, 1,000 and 229,000 shares of the Company’s common stock at exercise prices of $12.90, $5.25 and $3.74 per share, which were the respective closing prices per share of the Company’s common stock on the dates of grant, with estimated fair values of $6.60, $2.70 and $1.68, respectively. The options granted in 2011 vested as to 33% on each of April 1, 2012 and 2013 and vest as to 34% on April 1, 2014. The options granted in 2013 vested as to 33% on April 1, 2014, vest as to 33% on April 1, 2015 and vest as to 34% on April 1, 2016. The options expire 10 years from the date of grant. Fair value was determined using the Black-Scholes Option Pricing Model. For the August 1, 2011 grants, the inputs to estimating fair value were: exercise price of $12.90; estimated life of 5.0 years; expected volatility of 56.7%; and risk free interest rate of 2.50%. For the August 25, 2011 grants, the inputs to estimating fair value were: exercise price of $5.25; estimated life of 5.0 years; expected volatility of 56.7% and risk free interest rate of 2.50%. For the June 18, 2013 grants, the inputs to estimating fair value were: exercise price of $3.74; estimated life of 3.0 years; expected volatility of 68.0% and risk free interest rate of 0.57%. The Company estimates expected volatility using peer companies within its industry.
| F-35 |
PACIFIC ETHANOL, INC.
NOTES TO CONSOLIDATED FINANCIAL STATEMENTS
Summaries of the status of Company’s stock option plans as of December 31, 2014 and 2013 and of changes in options outstanding under the Company’s plans during those years are as follows (shares in thousands):
| Years Ended December 31, | ||||||||||||||||
| 2014 | 2013 | |||||||||||||||
| Number of Shares | Weighted Average Exercise Price | Number of Shares | Weighted Average Exercise Price | |||||||||||||
| Outstanding at beginning of year | 241 | $ | 6.91 | 13 | $ | 63.00 | ||||||||||
| Issued | – | $ | – | 229 | $ | 3.74 | ||||||||||
| Cancelled | – | $ | – | (1 | ) | $ | 12.90 | |||||||||
| Outstanding at end of year | 241 | $ | 6.91 | 241 | $ | 6.91 | ||||||||||
| Options exercisable at end of year | 89 | $ | 11.59 | 9 | $ | 88.08 | ||||||||||
Stock options outstanding as of December 31, 2014 were as follows (number of shares in thousands):
| Options Outstanding | Options Exercisable | |||||||||||||||||||
| Range of Exercise Prices | Number Outstanding | Weighted Average Remaining Contractual Life (yrs) | Weighted Average Exercise Price | Number Exercisable | Weighted Average Exercise Price | |||||||||||||||
| $3.74 | 229 | 8.47 | $ | 3.74 | 76 | $ | 3.74 | |||||||||||||
| $12.90 | 11 | 6.59 | $ | 12.90 | 11 | $ | 12.90 | |||||||||||||
| $866.25-$871.50 | 1 | 0.57 | $ | 867.23 | 1 | $ | 867.23 | |||||||||||||
The options outstanding at December 31, 2014 and 2013 had intrinsic values of $1,509,000 and $309,000, respectively.
| F-36 |
PACIFIC ETHANOL, INC.
NOTES TO CONSOLIDATED FINANCIAL STATEMENTS
Restricted Stock – The Company granted to certain employees and directors shares of restricted stock under its 2006 Stock Incentive Plan pursuant to restricted stock agreements. A summary of unvested restricted stock activity is as follows (shares in thousands):
| Number of Shares | Weighted Average Grant Date Fair Value Per Share | ||||||||
| Unvested at December 31, 2011 | 31 | $ | 64.05 | ||||||
| Vested | (13 | ) | $ | 81.90 | |||||
| Canceled | (2 | ) | $ | 61.20 | |||||
| Unvested at December 31, 2012 | 16 | $ | 50.40 | ||||||
| Issued | 615 | $ | 4.56 | ||||||
| Vested | (142 | ) | $ | 7.85 | |||||
| Canceled | (17 | ) | $ | 6.20 | |||||
| Unvested at December 31, 2013 | 472 | $ | 5.07 | ||||||
| Issued | 155 | $ | 15.23 | ||||||
| Vested | (227 | ) | $ | 5.79 | |||||
| Canceled | (10 | ) | $ | 4.30 | |||||
| Unvested at December 31, 2014 | 390 | $ | 8.71 | ||||||
The fair value of the common stock at vesting aggregated $3,858,000 and $601,000 for the years ended December 31, 2014 and 2013, respectively. Stock-based compensation expense related to employee and non-employee restricted stock and option grants recognized in income were as follows (in thousands):
| Years Ended December 31, | ||||||||
| 2014 | 2013 | |||||||
| Employees | $ | 1,493 | $ | 1,333 | ||||
| Non-employees | 345 | 391 | ||||||
| Total stock-based compensation expense | $ | 1,838 | $ | 1,724 | ||||
At December 31, 2014, the total compensation cost related to unvested awards which had not been recognized was $3,393,000 and the associated weighted-average period over which the compensation cost attributable to those unvested awards would be recognized is approximately 2 years.
| F-37 |
PACIFIC ETHANOL, INC.
NOTES TO CONSOLIDATED FINANCIAL STATEMENTS
| 11. | COMMITMENTS AND CONTINGENCIES. |
Commitments – The following is a description of significant commitments at December 31, 2014:
Leases – Future minimum lease payments required by non-cancelable leases in effect at December 31, 2014 are as follows (in thousands):
| Years Ended December 31, | Capital Leases | Operating Leases | ||||||
| 2015 | $ | 4,569 | $ | 1,145 | ||||
| 2016 | 900 | 1,107 | ||||||
| 2017 | 900 | 956 | ||||||
| 2018 | 568 | 878 | ||||||
| 2019 | – | 580 | ||||||
| Thereafter | – | 2,243 | ||||||
| Total minimum payments | 6,937 | $ | 6,909 | |||||
| Amount representing interest | (805 | ) | ||||||
| Obligations under capital leases | 6,132 | |||||||
| Obligations due within one year | (4,077 | ) | ||||||
| Long-term obligations under capital leases | $ | 2,055 | ||||||
Total rent expense during the years ended December 31, 2014, 2013 and 2012 was $2,417,000, $1,454,000 and $2,252,000, respectively.
Sales Commitments – At December 31, 2014, the Company had entered into sales contracts with its major customers to sell certain quantities of ethanol, WDG, corn oil and syrup. The Company had open ethanol indexed-price contracts for 163,502,000 gallons of ethanol as of December 31, 2014. The Company had open corn oil fixed-price sales contracts valued at $1,034,000 and open indexed-price sales contracts for 1,072,000 pounds of corn oil as of December 31, 2014. The Company had open WDG and syrup fixed-price sales contracts valued at $871,000 and open indexed-price sales contracts for 162,000 tons of WDG and syrup as of December 31, 2014. These sales contracts are scheduled to be completed throughout 2015.
Purchase Commitments – At December 31, 2014, the Company had indexed-price purchase contracts to purchase 33,330,000 gallons of ethanol and fixed-price purchase contracts to purchase $12,784,000 of ethanol from its suppliers. These purchase commitments are scheduled to be satisfied throughout 2015.
Other Commitments – At December 31, 2014, the Company had firm commitments to add corn oil separation and other process improvement projects at the Pacific Ethanol Plants of approximately $22.5 million, most of which is expected to be completed in 2015.
Contingencies – The following is a description of significant contingencies at December 31, 2014:
Litigation – General – The Company is subject to various claims and contingencies in the ordinary course of its business, including those related to litigation, business transactions, employee-related matters, and others. When the Company is aware of a claim or potential claim, it assesses the likelihood of any loss or exposure. If it is probable that a loss will result and the amount of the loss can be reasonably estimated, the Company will record a liability for the loss. If the loss is not probable or the amount of the loss cannot be reasonably estimated, the Company discloses the claim if the likelihood of a potential loss is reasonably possible and the amount involved could be material. While there can be no assurances, the Company does not expect that any of its pending legal proceedings will have a material financial impact on the Company’s operating results.
| F-38 |
PACIFIC ETHANOL, INC.
NOTES TO CONSOLIDATED FINANCIAL STATEMENTS
GS CleanTech – On May 24, 2013, GS CleanTech Corporation (“GS CleanTech”), filed a suit in the United States District Court for the Eastern District of California, Sacramento Division (Case No.: 2:13-CV-01042-JAM-AC), naming Pacific Ethanol, Inc. as a defendant. On August 29, 2013, the case was transferred to the United States District Court for the Southern District of Indiana and made part of the pre-existing multi-district litigation involving GS CleanTech and multiple defendants. The suit alleged infringement of a patent assigned to GS CleanTech by virtue of certain corn oil separation technology in use at one or more of the ethanol production facilities in which the Company has an interest, including Pacific Ethanol Stockton LLC (“PE Stockton”), located in Stockton, California. The complaint sought preliminary and permanent injunctions against the Company, prohibiting future infringement on the patent owned by GS CleanTech and damages in an unspecified amount adequate to compensate GS CleanTech for the alleged patent infringement, but in any event no less than a reasonable royalty for the use made of the inventions of the patent, plus attorneys’ fees. The Company answered the complaint, counterclaimed that the patent claims at issue, as well as the claims in several related patents, are invalid and unenforceable and that the Company is not infringing. Pacific Ethanol, Inc. does not itself use any corn oil separation technology and may seek a dismissal on those grounds.
On March 17 and March 18, 2014, GS CleanTech filed suit naming as defendants two Company subsidiaries: PE Stockton and Pacific Ethanol Magic Valley, LLC (“PE Magic Valley”). The claims were similar to those filed against Pacific Ethanol, Inc. in May 2013. These two cases were transferred to the multi-district litigation division in United States District Court for the Southern District of Indiana, where the case against Pacific Ethanol, Inc. was pending. Although PE Stockton and PE Magic Valley do separate and market corn oil, the Company, PE Stockton and PE Magic Valley strongly disagree that either of the subsidiaries use corn oil separation technology that infringes the patent owned by GS CleanTech. In a January 16, 2015 decision, the District Court for the Southern District of Indiana ruled in favor of a stipulated motion for partial summary judgment for the Company, PE Stockton and PE Magic Valley finding that all of the GS Cleantech patents in the suit were invalid and, therefore, not infringed. GS Cleantech has said it will appeal this decision when the remaining claim in the suit has been decided. The only remaining claim alleges that GS Cleantech inequitably conducted itself before the United States Patent Office when obtaining the patents at issue. A trial in the District Court for the Southern District of Indiana on that single issue is expected later in 2015. If the Defendants, including the Company, PE Stockton and PE Magic Valley, succeed in proving inequitable conduct, then the Court will be asked to determine whether GS Cleantech’s behavior makes this an “exceptional case”. A finding that this is an exceptional case would allow the Court to award to the Company, PE Stockton and PE Magic Valley the attorneys’ fees expended to date for defense in this case. It is unknown whether GS Cleantech would appeal such a ruling. The Company did not record a provision for these matters as of December 31, 2014 as Company management intends to vigorously defend these allegations and believes a material adverse ruling against Pacific Ethanol, Inc., PE Stockton and/or PE Magic Valley is not probable. The Company believes that any liability Pacific Ethanol, Inc., PE Stockton and/or PE Magic Valley may incur would not have a material adverse effect on the Company’s financial condition or its results of operations.
| F-39 |
PACIFIC ETHANOL, INC.
NOTES TO CONSOLIDATED FINANCIAL STATEMENTS
| 12. | FAIR VALUE MEASUREMENTS. |
The fair value hierarchy prioritizes the inputs used in valuation techniques into three levels, as follows:
| · | Level 1 – Observable inputs – unadjusted quoted prices in active markets for identical assets and liabilities; |
| · | Level 2 – Observable inputs other than quoted prices included in Level 1 that are observable for the asset or liability through corroboration with market data; and |
| · | Level 3 – Unobservable inputs – includes amounts derived from valuation models where one or more significant inputs are unobservable. For fair value measurements using significant unobservable inputs, a description of the inputs and the information used to develop the inputs is required along with a reconciliation of Level 3 values from the prior reporting period. |
The Company recorded its warrants issued from 2011 through 2013 and the conversion features associated with its convertible notes at fair value and designated them as Level 3 on their issuance date.
Warrants – Except for the warrants issued September 26, 2012, the Company’s warrants were valued using a Monte Carlo Binomial Lattice-Based valuation methodology, adjusted for marketability restrictions. The warrants issued September 26, 2012, due to no anti-dilution protection features, were valued using the Black-Scholes Valuation Model.
Significant assumptions used and related fair values for the warrants as of December 31, 2014 were as follows:
| Original Issuance | Exercise Price | Volatility | Risk Free Interest Rate | Term (years) | Market Discount | Warrants Outstanding | Fair Value | |||||||||||||||||||||
| 09/26/2012 | $ | 8.85 | 51.0% | 0.19% | 0.74 | 37.0% | 473,000 | 748,000 | ||||||||||||||||||||
| 07/3/2012 | $ | 6.09 | 56.1% | 0.89% | 2.51 | 32.8% | 211,000 | 811,000 | ||||||||||||||||||||
| 12/13/2011 | $ | 8.43 | 54.3% | 0.67% | 1.95 | 28.7% | 138,000 | 427,000 | ||||||||||||||||||||
| $ | 1,986,000 | |||||||||||||||||||||||||||
Significant assumptions used and related fair values for the warrants as of December 31, 2013 were as follows:
| Original Issuance | Exercise Price | Volatility | Risk Free Interest Rate | Term (years) | Market Discount | Warrants Outstanding | Fair Value | |||||||||||||||||||||
| 06/21/2013 | $ | 7.59 | 52.4% | 0.13% | 1.24 | 22.7% | 1,051,000 | $ | 660,000 | |||||||||||||||||||
| 03/28/2013 | $ | 7.59 | 52.4% | 0.13% | 1.20 | 22.7% | 788,000 | 495,000 | ||||||||||||||||||||
| 01/11/2013 | $ | 6.32 | 63.3% | 1.27% | 4.03 | 43.8% | 1,709,000 | 2,892,000 | ||||||||||||||||||||
| 09/26/2012 | $ | 8.85 | 58.5% | 0.38% | 1.74 | 42.3% | 1,771,000 | 702,000 | ||||||||||||||||||||
| 07/3/2012 | $ | 6.09 | 61.2% | 1.27% | 3.51 | 40.2% | 1,812,000 | 3,008,000 | ||||||||||||||||||||
| 07/3/2012 | $ | 5.47 | 52.8% | 0.01% | 0.01 | 42.3% | 804,000 | 3,000 | ||||||||||||||||||||
| 12/13/2011 | $ | 8.43 | 60.4% | 0.78% | 2.95 | 37.9% | 306,000 | 455,000 | ||||||||||||||||||||
| $ | 8,215,000 | |||||||||||||||||||||||||||
| F-40 |
PACIFIC ETHANOL, INC.
NOTES TO CONSOLIDATED FINANCIAL STATEMENTS
The estimated fair value of the warrants is affected by the above underlying inputs. Observable inputs include the values of exercise price, stock price, term and risk-free interest rate. As separate inputs, an increase (decrease) in either the term or risk free interest rate will result in an increase (decrease) in the estimated fair value of the warrant.
Unobservable inputs include volatility and market discount. An increase (decrease) in volatility will result in an increase (decrease) in the estimated warrant value and an increase (decrease) in the market discount will result in a decrease (increase) in the estimated warrant fair value.
The volatility utilized was a blended average of the Company’s historical volatility and implied volatilities derived from a selected peer group. The implied volatility component has remained relatively constant over time given that implied volatility is a forward-looking assumption based on observable trades in public option markets. Should the Company’s historical volatility increase (decrease) on a go-forward basis, the resulting value of the warrants would increase (decrease).
The market discount, or a discount for lack of marketability, is quantified using a Black-Scholes option pricing model, with a primary model input of assumed holding period restriction. As the assumed holding period increases (decreases), the market discount increases (decreases), conversely impacting the value of the warrant fair value.
Convertible Notes – The conversion feature imbedded in the convertible notes was valued using a Monte Carlo Binomial Lattice-Based valuation methodology, adjusted for marketability restrictions. The Company estimated the fair value of the conversion feature until the retirement of the convertible notes in December 2013.
Other Derivative Instruments – The Company’s other derivative instruments consist of commodity positions. The fair values of the commodity positions are based on quoted prices on the commodity exchanges and are designated as Level 1 inputs.
The following table summarizes fair value measurements by level at December 31, 2014 (in thousands):
| Level 1 | Level 2 | Level 3 | Total | |||||||||||||
| Assets: | ||||||||||||||||
| Commodity contracts(1) | $ | 1,586 | $ | – | $ | – | $ | 1,586 | ||||||||
| Total Assets | $ | 1,586 | $ | – | $ | – | $ | 1,586 | ||||||||
| Liabilities: | ||||||||||||||||
| Warrants(2) | $ | – | $ | – | $ | 1,986 | $ | 1,986 | ||||||||
| Commodity contracts(3) | 1,149 | – | – | 1,149 | ||||||||||||
| Total Liabilities | $ | 1,149 | $ | – | $ | 1,986 | $ | 3,135 | ||||||||
_______________
| (1) | Included in other current assets in the consolidated balance sheets. | |
| (2) | Included in warrant liabilities at fair value in the consolidated balance sheets. | |
| (3) | Included in accrued liabilities in the consolidated balance sheets. |
| F-41 |
PACIFIC ETHANOL, INC.
NOTES TO CONSOLIDATED FINANCIAL STATEMENTS
The following table summarizes fair value measurements by level at December 31, 2013 (in thousands):
| Level 1 | Level 2 | Level 3 | Total | |||||||||||||
| Assets: | ||||||||||||||||
| Commodity contracts(1) | $ | 961 | $ | – | $ | – | $ | 961 | ||||||||
| Total Assets | $ | 961 | $ | – | $ | – | $ | 961 | ||||||||
| Liabilities: | ||||||||||||||||
| Warrants(2) | $ | – | $ | – | $ | 8,215 | $ | 8,215 | ||||||||
| Commodity contracts(3) | 859 | – | – | 859 | ||||||||||||
| Total Liabilities | $ | 859 | $ | – | $ | 8,215 | $ | 9,074 | ||||||||
_______________
| (1) | Included in other current assets in the consolidated balance sheets. | |
| (2) | Included in warrant liabilities at fair value in the consolidated balance sheets. | |
| (3) | Included in accrued liabilities in the consolidated balance sheets. |
For fair value measurements using significant unobservable inputs (Level 3), a description of the inputs and the information used to develop the inputs is required along with a reconciliation of Level 3 values from the prior reporting period. The changes in the Company’s fair value of its Level 3 inputs with respect to its warrants were as follows (in thousands):
| Warrants | Conversion Features | |||||||
| Balance, December 31, 2011 | $ | 1,921 | $ | – | ||||
| Issuance of warrants in July offering | 3,380 | – | ||||||
| Issuance of warrants in September offering | 1,658 | – | ||||||
| Exercises of warrants | (113 | ) | – | |||||
| Adjustments to fair value for the period | (1,954 | ) | – | |||||
| Balance, December 31, 2012 | $ | 4,892 | $ | – | ||||
| Issuance of warrants in January offering | $ | 2,657 | $ | – | ||||
| Issuance of notes and warrants in March offering | 1,572 | 1,401 | ||||||
| Issuance of notes in June offering | – | 2,929 | ||||||
| Conversions of notes | – | (5,205 | ) | |||||
| Exercises of warrants | (260 | ) | – | |||||
| Adjustments to fair value for the period | (646 | ) | 875 | |||||
| Balance, December 31, 2013 | $ | 8,215 | $ | – | ||||
| Exercises of warrants | (41,486 | ) | – | |||||
| Expiration of warrants | (3 | ) | – | |||||
| Adjustments to fair value for the period | 35,260 | – | ||||||
| Balance, December 31, 2014 | $ | 1,986 | $ | – | ||||
| F-42 |
PACIFIC ETHANOL, INC.
NOTES TO CONSOLIDATED FINANCIAL STATEMENTS
| 13. | RELATED PARTY TRANSACTIONS. |
Preferred Dividends – The Company had accrued and unpaid dividends in respect of its Series B Preferred Stock of $0 and $3,657,000 as of December 31, 2014 and 2013, respectively. As further discussed in Note 8, the Company issued common stock in payment of certain accrued and unpaid dividends.
Note Payable to Related Party – The Company had a note payable to its Chief Executive Officer totaling $750,000 as of December 31, 2013, which was paid in full in cash on its maturity date on March 31, 2014.
| 14. | MERGER AGREEMENT WITH AVENTINE. |
On December 30, 2014, The Company entered into a definitive merger agreement with Aventine Renewable Energy Holdings, Inc. (“Aventine”), a Midwest ethanol producer, under which the Company plans to acquire Aventine through a merger. The merger agreement provides that, upon the terms and subject to the conditions set forth in the merger agreement, a wholly-owned subsidiary of the Company will merge with and into Aventine, with Aventine surviving as a wholly-owned subsidiary of the Company. Subject to the terms and conditions of the merger agreement which was approved by the Company’s and Aventine’s boards of directors, if the merger is completed, each outstanding share of Aventine common stock will be converted into the right to receive 1.25 shares of the Company’s common stock, and the Company will issue approximately 17.75 million shares of its common stock. The merger is expected to result in the Company’s stockholders holding approximately 58% of the combined company.
The merger transaction, which is intended to be structured as a tax-free exchange of shares, is expected to close during the second quarter of 2015, and is subject to closing conditions, including obtaining certain regulatory approvals and approvals from the stockholders of both companies.
| 15. | QUARTERLY FINANCIAL DATA. |
The Company’s unaudited quarterly results of operations for the years ended December 31, 2014 and 2013 are as follows (in thousands):
| First Quarter | Second Quarter | Third Quarter | Fourth Quarter | |||||||||||||
| December 31, 2014: | ||||||||||||||||
| Net sales | $ | 254,543 | $ | 321,144 | $ | 275,573 | $ | 256,152 | ||||||||
| Gross profit | $ | 38,545 | $ | 33,576 | $ | 17,986 | $ | 18,378 | ||||||||
| Income from operations | $ | 34,875 | $ | 29,261 | $ | 13,594 | $ | 13,647 | ||||||||
| Net income (loss) attributed to Pacific Ethanol, Inc. | $ | (10,826 | ) | $ | 15,572 | $ | 4,025 | $ | 12,518 | |||||||
| Preferred stock dividends | $ | (312 | ) | $ | (315 | ) | $ | (319 | ) | $ | (319 | ) | ||||
| Net income (loss) available to common stockholders | $ | (11,138 | ) | $ | 15,257 | $ | 3,706 | $ | 12,199 | |||||||
| Income (loss) per common share: | ||||||||||||||||
| Basic | $ | (0.69 | ) | $ | 0.77 | $ | 0.16 | $ | 0.51 | |||||||
| Diluted | $ | (0.69 | ) | $ | 0.68 | $ | 0.15 | $ | 0.50 | |||||||
| F-43 |
PACIFIC ETHANOL, INC.
NOTES TO CONSOLIDATED FINANCIAL STATEMENTS
| First Quarter | Second Quarter | Third Quarter | Fourth Quarter | |||||||||||||
| December 31, 2013: | ||||||||||||||||
| Net sales | $ | 225,459 | $ | 233,808 | $ | 233,880 | $ | 215,290 | ||||||||
| Gross profit | $ | 846 | $ | 6,965 | $ | 3,523 | $ | 21,596 | ||||||||
| Income (loss) from operations | $ | (3,159 | ) | $ | 3,832 | $ | 1,012 | $ | 17,224 | |||||||
| Net income (loss) attributed to Pacific Ethanol, Inc. | $ | (5,454 | ) | $ | 1,051 | $ | (4,971 | ) | $ | 8,593 | ||||||
| Preferred stock dividends | $ | (312 | ) | $ | (315 | ) | $ | (319 | ) | $ | (319 | ) | ||||
| Net income (loss) available to common stockholders | $ | (5,766 | ) | $ | 736 | $ | (5,290 | ) | $ | 8,274 | ||||||
| Loss per common share: | ||||||||||||||||
| Basic | $ | (0.57 | ) | $ | 0.07 | $ | (0.40 | ) | $ | 0.55 | ||||||
| Diluted | $ | (0.57 | ) | $ | 0.07 | $ | (0.40 | ) | $ | 0.54 | ||||||
| F-44 |
INDEX TO EXHIBITS
Where Located | ||||||
Exhibit |
Description* |
Form |
File Number |
Exhibit Number |
Filing Date |
Filed Herewith |
| 2.1 | Agreement for Purchase and Sale of Loans and Units in New PE Holdco LLC dated March 27, 2013 among the Registrant, Cooperatieve Centrale Raiffeisen-Boerenleenbank B.A., “Rabobank Nederland”, New York Branch and Series G of Special Assets Equity Holdings Series, LLC | S-1 | 333-189713 | 2.15 | 6/28/2013 | |
| 2.2 | Agreement for Purchase and Sale of Loans and Units in New PE Holdco LLC dated June 21, 2013 among the Registrant, NordkapAG and NKPacific, LLC | 8-K | 000-21467 | 10.3 | 06/26/2013 | |
| 2.3 | Form of Agreement for Purchase and Sale of Units in New PE Holdco LLC dated December 6, 2013 between the Registrant and each of CIFC Funding 2007-III Asset-V LLC and CIFC Funding 2007-IV Asset-IV LLC | 10-K | 000-21467 | 2.13 | 03/31/2014 | |
| 2.4 | Agreement for Purchase and Sale of Units in New PE Holdco LLC dated December 10, 2013 between the Registrant and Armory Fund L.P. | 10-K | 000-21467 | 2.14 | 03/31/2014 | |
| 2.5 | Form of Agreement for Purchase and Sale of Units in New PE Holdco LLC dated December 14, 2013 between the Registrant and each of Mariner Partners, L.P. and Dee River Holdings, Inc. | 10-K | 000-21467 | 2.15 | 03/31/2014 | |
| 2.6 | Agreement and Plan of Merger dated as of December 30, 2014 by and among Pacific Ethanol, Inc., AVR Merger Sub, Inc. and Aventine Renewable Energy Holdings, Inc. | 8-K | 000-21467 | 2.1 | 12/31/2014 | |
| 3.1 | Certificate of Incorporation | 10-Q | 000-21467 | 3.1 | 08/07/2013 | |
| 3.2 | Certificate of Designations, Powers, Preferences and Rights of the Series A Cumulative Redeemable Convertible Preferred Stock | 10-Q | 000-21467 | 3.2 | 08/07/2013 | |
| 3.3 | Certificate of Designations, Powers, Preferences and Rights of the Series B Cumulative Convertible Preferred Stock | 10-Q | 000-21467 | 3.3 | 08/07/2013 | |
| 3.4 | Certificate of Amendment to Certificate of Incorporation dated June 10, 2010 | 10-Q | 000-21467 | 3.4 | 08/07/2013 | |
| 104 |
Where Located | ||||||
Exhibit |
Description* |
Form |
File Number |
Exhibit Number |
Filing Date |
Filed Herewith |
| 3.5 | Certificate of Amendment to Certificate of Incorporation dated June 8, 2011 | 10-Q | 000-21467 | 3.5 | 08/07/2013 | |
| 3.6 | Certificate of Amendment to Certificate of Incorporation dated May 14, 2013 | 10-Q | 000-21467 | 3.6 | 08/07/2013 | |
| 3.7 | Amended and Restated Bylaws | 10-Q | 000-21467 | 3.1 | 11/12/2014 | |
| 10.1 | 2004 Stock Option Plan# | S-8 | 333-123538 | 4.1 | 03/24/2005 | |
| 10.2 | First Amendment to 2004 Stock Option Plan# | 8-K | 000-21467 | 10.3 | 02/01/2006 | |
| 10.3 | 2006 Stock Incentive Plan, as amended# | S-8 | 333-196876 | 4.1 | 06/18/2014 | |
| 10.4 | Form of Employee Restricted Stock Agreement# | 8-K | 000-21467 | 10.2 | 10/10/2006 | |
| 10.5 | Form of Non-Employee Director Restricted Stock Agreement# | 8-K | 000-21467 | 10.3 | 10/10/2006 | |
| 10.6 | Amended and Restated Executive Employment Agreement dated December 11, 2007 between the Registrant and Neil M. Koehler# | 8-K | 000-21467 | 10.3 | 12/17/2007 | |
| 10.7 | Amended and Restated Executive Employment Agreement dated December 11, 2007 between the Registrant and Christopher W. Wright# | 8-K | 000-21467 | 10.5 | 12/17/2007 | |
| 10.8 | Amended and Restated Executive Employment Agreement dated November 25, 2009 between the Registrant and Bryon T. McGregor# | 8-K | 000-21467 | 10.1 | 11/27/2009 | |
| 10.9 | Executive Employment Agreement dated January 6, 2013 between the Registrant and Michael D. Kandris# | 8-K | 000-21467 | 10.1 | 01/10/2013 | |
| 10.10 | Amended and Restated Executive Employment Agreement dated October 1, 2012 between the Registrant and Paul P. Kohler# | 10-K | 000-21467 | 10.11 | 03/31/2014 | |
| 10.11 | Employment Agreement dated November 12, 2012 between the Registrant and James R. Sneed# | 10-K | 000-21467 | 10.12 | 03/31/2014 | |
| 10.12 | Pacific Ethanol, Inc. 2014 Short-Term Incentive Plan Description# | 8-K | 000-21467 | 10.1 | 06/13/2014 | |
| 10.13 | Kinergy Marketing LLC 2014 Short-Term Incentive Plan Description# | 8-K | 000-21467 | 10.2 | 06/13/2014 | |
| 10.14 | Form of Indemnity Agreement between the Registrant and each of its Executive Officers and Directors# | 10-K | 000-21467 | 10.46 | 03/31/2010 | |
| 105 |
Where Located | ||||||
Exhibit |
Description* |
Form |
File Number |
Exhibit Number |
Filing Date |
Filed Herewith |
| 10.15 | Warrant dated March 27, 2008 issued by the Registrant to Lyles United, LLC | 8-K | 000-21467 | 10.3 | 03/27/2008 | |
| 10.16 | Registration Rights Agreement dated March 27, 2008 between the Registrant and Lyles United, LLC | 8-K | 000-21467 | 10.4 | 03/27/2008 | |
| 10.17 | Letter Agreement dated March 27, 2008 between the Registrant and Lyles United, LLC | 8-K | 000-21467 | 10.5 | 03/27/2008 | |
| 10.18 | Form of Warrant dated May 22, 2008 issued by the Registrant | 8-K | 000-21467 | 10.2 | 05/23/2008 | |
| 10.19 | Letter Agreement dated May 22, 2008 among the Registrant, Neil M. Koehler, Bill Jones, Paul P. Koehler and Thomas D. Koehler# | 8-K | 000-21467 | 10.3 | 05/23/2008 | |
| 10.20 | Form of Warrant dated May 23, 2008 issued by the Registrant | 8-K | 000-21467 | 10.5 | 05/23/2008 | |
| 10.21 | Amended and Restated Loan and Security Agreement dated May 4, 2012 among Kinergy Marketing LLC, Pacific Ag. Products, LLC, the parties thereto from time to time as Lenders, Wells Fargo Bank, National Association and Wells Fargo Capital Finance, LLC | 8-K | 000-21467 | 10.1 | 05/08/2012 | |
| 10.22 | Amended and Restated Guarantee dated May 4, 2012 by the Registrant in favor of Wells Fargo Capital Finance, LLC for and on behalf of Lenders | 8-K | 000-21467 | 10.2 | 05/08/2012 | |
| 10.23 | Second Amended and Restated Asset Management Agreement dated June 30, 2011 among the Registrant, Pacific Ethanol Holding Co. LLC, Pacific Ethanol Madera LLC, Pacific Ethanol Columbia, LLC, Pacific Ethanol Stockton LLC and Pacific Ethanol Magic Valley, LLC | 8-K | 000-21467 | 10.1 | 07/06/2011 | |
| 10.24 | Form of Amended and Restated Ethanol Marketing Agreement | 8-K | 000-21467 | 10.2 | 07/06/2011 | |
| 10.25 | Form of Amended and Restated Corn Procurement and Handling Agreement | 8-K | 000-21467 | 10.4 | 07/06/2011 | |
| 10.26 | Form of Amended and Restated Distillers Grains Marketing Agreement | 8-K | 000-21467 | 10.5 | 07/06/2011 | |
| 10.27 | Limited Liability Company Agreement of New PE Holdco LLC | 10-K | 000-21467 | 10.34 | 03/31/2011 | |
| 106 |
Where Located | ||||||
Exhibit |
Description* |
Form |
File Number |
Exhibit Number |
Filing Date |
Filed Herewith |
| 10.28 | Form of Warrants dated January 7, 2011 issued by the Registrant | 8-K | 000-21467 | 10.3 | 01/07/2011 | |
| 10.29 | Form of Warrants dated December 13, 2011 issued by the Registrant | 8-K/A | 000-21467 | 10.2 | 12/12/2011 | |
| 10.30 | Form of Series I Warrants and Series II Warrants issued by the Registrant on July 3, 2012 (the forms of Series I Warrants and Series II Warrants are identical in all respects other than the exercise price and term applicable to each of such series of Warrants) | 8-K | 000-21467 | 10.1 | 06/28/2012 | |
| 10.31 | Form of Warrants dated September 26, 2012 issued by the Registrant | 8-K | 000-21467 | 10.1 | 09/21/2012 | |
| 10.32 | Second Amended and Restated Credit Agreement dated October 29, 2012 among Pacific Ethanol Holding Co. LLC, Pacific Ethanol Madera LLC, Pacific Ethanol Columbia, LLC, Pacific Ethanol Stockton LLC, Pacific Ethanol Magic Valley, LLC, the Lenders referred to therein, Wells Fargo Bank, N.A. and Amarillo National Bank | 10-Q | 000-21467 | 10.6 | 11/14/2012 | |
| 10.33 | First Amendment to Second Amended and Restated Credit Agreement dated January 4, 2013 among Pacific Ethanol Holding Co. LLC, Pacific Ethanol Madera LLC, Pacific Ethanol Columbia, LLC, Pacific Ethanol Stockton LLC, Pacific Ethanol Magic Valley, LLC, the Lenders referred to therein, Wells Fargo Bank, N.A. and the other parties identified therein | S-1 | 333-189713 | 10.44 | 06/28/2013 | |
| 10.34 | Third Amendment to Second Amended and Restated Credit Agreement dated April 1, 2014 among Pacific Ethanol Holding Co. LLC, Pacific Ethanol Madera LLC, Pacific Ethanol Columbia, LLC, Pacific Ethanol Stockton LLC, Pacific Ethanol Magic Valley, LLC, the Lenders referred to therein, Wells Fargo Bank, N.A. and the other parties identified therein | 8-K | 000-21467 | 10.2 | 04/01/2014 | |
| 10.35 | Lender Assignment Agreement dated June 9, 2014 between Pacific Ethanol, Inc. and CWD OC 522 Master Fund, Ltd. | 8-K | 000-21467 | 10.1 | 06/10/2014 | |
| 107 |
Where Located | ||||||
Exhibit |
Description* |
Form |
File Number |
Exhibit Number |
Filing Date |
Filed Herewith |
| 10.36 | Lender Assignment Agreement dated June 9, 2014 between Pacific Ethanol, Inc. and Candlewood Special Situations Master Fund, Ltd. | 8-K | 000-21467 | 10.2 | 06/10/2014 | |
| 10.37 | Agreement for Purchase and Sale of Loans and Assignment of Commitment dated June 9, 2014 between Pacific Ethanol, Inc. and Candlewood Credit Value Master Fund II, L.P. | 8-K | 000-21467 | 10.3 | 06/10/2014 | |
| 10.38 | Credit Agreement dated October 29, 2012 among Pacific Ethanol Holding Co. LLC, Pacific Ethanol Madera LLC, Pacific Ethanol Columbia, LLC, Pacific Ethanol Stockton LLC, Pacific Ethanol Magic Valley, LLC, the Lenders referred to therein, Wells Fargo Bank, N.A., Credit Suisse Loan Funding LLC and Amarillo National Bank | 10-Q | 000-21467 | 10.7 | 11/14/2012 | |
| 10.39 | First Amendment to Credit Agreement dated January 4, 2013, among Pacific Ethanol Holding Co. LLC, Pacific Ethanol Madera LLC, Pacific Ethanol Columbia, LLC, Pacific Ethanol Stockton LLC, Pacific Ethanol Magic Valley, LLC, the Lenders referred to therein, Wells Fargo Bank, N.A., Credit Suisse Loan Funding LLC and the other parties identified therein | S-1 | 333-189713 | 10.46 | 06/28/2013 | |
| 10.40 | Second Amendment to Credit Agreement dated April 1, 2014 among Pacific Ethanol Holding Co. LLC, Pacific Ethanol Madera LLC, Pacific Ethanol Columbia, LLC, Pacific Ethanol Stockton LLC, Pacific Ethanol Magic Valley, LLC, the Lenders referred to therein, Wells Fargo Bank, N.A., Amarillo National Bank and the other parties identified therein | 8-K | 000-21467 | 10.1 | 04/01/2014 | |
| 10.41 | Intercreditor Agreement dated October 29, 2012 among Pacific Ethanol Holding Co. LLC, Pacific Ethanol Madera LLC, Pacific Ethanol Columbia, LLC, Pacific Ethanol Stockton LLC, Pacific Ethanol Magic Valley, LLC and Wells Fargo Bank, N.A. | 10-Q | 000-21467 | 10.8 | 11/14/2012 | |
| 108 |
Where Located | ||||||
Exhibit |
Description* |
Form |
File Number |
Exhibit Number |
Filing Date |
Filed Herewith |
| 10.42 | First Amendment to Intercreditor Agreement and Consent dated April 1, 2014 among Pacific Ethanol Holding Co. LLC, Pacific Ethanol Madera LLC, Pacific Ethanol Columbia, LLC, Pacific Ethanol Stockton LLC, Pacific Ethanol Magic Valley, LLC and Wells Fargo Bank, N.A. | 8-K | 000-21467 | 10.3 | 04/01/2014 | |
| 10.43 | Form of Amendment Agreement dated March 28, 2013 among the Registrant and the investors identified therein | 8-K | 000-21467 | 10.6 | 03/28/2013 | |
| 10.44 | Securities Purchase Agreement dated March 28, 2013 between the Registrant and the investors identified therein | 8-K | 000-21467 | 10.1 | 03/28/2013 | |
| 10.45 | Form of Series A Notes issued on March 28, 2013 and Series B Notes issued on June 20, 2013 | 8-K | 000-21467 | 10.2 | 03/28/2013 | |
| 10.46 | Form of Series A Warrants and Series B Warrants issued on March 28, 2013 | 8-K | 000-21467 | 10.3 | 03/28/2013 | |
| 10.47 | Form of Base Indenture between the Registrant and U.S. Bank, National Association | 8-K | 000-21467 | 10.4 | 03/28/2013 | |
| 10.48 | Form of First Supplemental Indenture and Second Supplemental Indenture | 8-K | 000-21467 | 10.5 | 03/28/2013 | |
| 10.49 | Letter Agreement dated December 16, 2013 among the Registrant and the holders of the Registrant’s Series B Cumulative Convertible Preferred Stock | 8-K | 000-21467 | 10.1 | 12/16/2013 | |
| 10.50 | Letter Agreement dated May 23, 2014 among the Registrant and the holders of the Registrant’s Series B Cumulative Convertible Preferred Stock | 8-K | 000-21467 | 10.1 | 05/28/2014 | |
| 10.51 | Stockholders Agreement dated December 30, 2014 between Pacific Ethanol, Inc. and the parties identified therein | 8-K | 000-21467 | 10.1 | 12/31/2014 | |
| 10.52 | Stockholders Agreement dated December 30, 2014 between Pacific Ethanol, Inc. and Credit Suisse Securities (USA) LLC | 8-K | 000-21467 | 10.2 | 12/31/2014 | |
| 21.1 | Subsidiaries of the Registrant | X | ||||
| 23.1 | Consent of Independent Registered Public Accounting Firm | X | ||||
| 109 |
Where Located | ||||||
Exhibit |
Description* |
Form |
File Number |
Exhibit Number |
Filing Date |
Filed Herewith |
| 31.1 | Certification Required by Rule 13a-14(a) of the Securities Exchange Act of 1934, as amended, as Adopted Pursuant to Section 302 of the Sarbanes-Oxley Act of 2002 | X | ||||
| 31.2 | Certification Required by Rule 13a-14(a) of the Securities Exchange Act of 1934, as amended, as Adopted Pursuant to Section 302 of the Sarbanes-Oxley Act of 2002 | X | ||||
| 32.1 | Certification of Chief Executive Officer and Chief Financial Officer Pursuant to 18 U.S.C. Section 1350, as Adopted Pursuant to Section 906 of the Sarbanes-Oxley Act of 2002 | X | ||||
| 99.1 | List of Companies Included in Hay Group Survey Data | X | ||||
| 101.INS | XBRL Instance Document | X | ||||
| 101.SCH | XBRL Taxonomy Extension Schema | X | ||||
| 101.CAL | XBRL Taxonomy Extension Calculation Linkbase | X | ||||
| 101.DEF | XBRL Taxonomy Extension Definition Linkbase | X | ||||
| 101.LAB | XBRL Taxonomy Extension Label Linkbase | X | ||||
| 101.PRE | XBRL Taxonomy Extension Presentation Linkbase | X | ||||
_______________
| (#) | A contract, compensatory plan or arrangement to which a director or executive officer is a party or in which one or more directors or executive officers are eligible to participate. | |
| (*) | Certain of the agreements filed as exhibits contain representations and warranties made by the parties thereto. The assertions embodied in such representations and warranties are not necessarily assertions of fact, but a mechanism for the parties to allocate risk. Accordingly, investors should not rely on the representations and warranties as characterizations of the actual state of facts or for any other purpose at the time they were made or otherwise. |
| 110 |
SIGNATURES
Pursuant to the requirements of Section 13 or 15(d) of the Securities Exchange Act of 1934, the registrant has duly caused this report to be signed on its behalf by the undersigned, thereunto duly authorized on this 16th day of March, 2015.
PACIFIC ETHANOL, INC.
/s/ NEIL M. KOEHLER
Neil M. Koehler President and Chief Executive Officer
Pursuant to the requirements of the Securities Exchange Act of 1934, this report has been signed below by the following persons on behalf of the Registrant and in the capacities and on the dates indicated.
| Signature | Title | Date | ||
|
/s/ WILLIAM L. JONES |
Chairman of the Board and Director | March 16, 2015 | ||
| William L. Jones | ||||
|
/s/ NEIL M. KOEHLER |
President, Chief Executive Officer |
March 16, 2015 | ||
| Neil M. Koehler | (Principal Executive Officer) and Director | |||
|
/s/ BRYON T. MCGREGOR |
Chief Financial Officer (Principal Financial |
March 16, 2015 | ||
| Bryon T. McGregor | and Accounting Officer) | |||
|
/s/ MICHAEL D. KANDRIS |
Chief Operating Officer and Director | March 16, 2015 | ||
| Michael D. Kandris | ||||
|
/s/ TERRY L. STONE |
Director | March 16, 2015 | ||
| Terry L. Stone | ||||
|
/s/ JOHN L. PRINCE |
Director | March 16, 2015 | ||
| John L. Prince | ||||
|
/s/ DOUGLAS L. KIETA |
Director | March 16, 2015 | ||
| Douglas L. Kieta | ||||
|
/s/ LARRY D. LAYNE |
Director | March 16, 2015 | ||
| Larry D. Layne |
| 111 |
EXHIBITS FILED WITH THIS REPORT
|
Exhibit Number |
Description |
| 21.1 | Subsidiaries of the Registrant |
| 23.1 | Consent of Independent Registered Public Accounting Firm |
| 31.1 | Certification Required by Rule 13a-14(a) of the Securities Exchange Act of 1934, as amended, as Adopted Pursuant to Section 302 of the Sarbanes-Oxley Act of 2002 |
| 31.2 | Certification Required by Rule 13a-14(a) of the Securities Exchange Act of 1934, as amended, as Adopted Pursuant to Section 302 of the Sarbanes-Oxley Act of 2002 |
| 32.1 | Certification of Chief Executive Officer and Chief Financial Officer Pursuant to 18 U.S.C. Section 1350, as Adopted Pursuant to Section 906 of the Sarbanes-Oxley Act of 2002 |
| 99.1 | List of Companies Included in Hay Group Survey Data |
| 101.INS | XBRL Instance Document |
| 101.SCH | XBRL Taxonomy Extension Schema |
| 101.CAL | XBRL Taxonomy Extension Calculation Linkbase |
| 101.DEF | XBRL Taxonomy Extension Definition Linkbase |
| 101.LAB | XBRL Taxonomy Extension Label Linkbase |
| 101.PRE | XBRL Taxonomy Extension Presentation Linkbase |
| 112 |