| x |
ANNUAL
REPORT PURSUANT TO SECTION 13 OR 15(d) OF THE SECURITIES EXCHANGE
ACT OF
1934 For the fiscal year ended December 31,
2006
|
| ¨ |
TRANSITION
REPORT PURSUANT TO SECTION 13 OR 15(d) OF THE SECURITIES EXCHANGE
ACT OF
1934 For the transition period from
to
|
|
Delaware
|
41-2170618
|
|
(State
or other jurisdiction of incorporation or
organization)
|
(I.R.S.
Employer Identification
No.)
|
|
400
Capitol Mall, Suite 2060, Sacramento, California
|
95814
|
|
(Address
of principal executive offices)
|
(Zip
Code)
|
|
Large
accelerated filer x
|
Accelerated
filer ¨
|
Non-accelerated
filer ¨
|
|
Page
|
||
|
PART I
|
||
|
Item
1.
|
Business
|
1
|
|
Item
1A.
|
Risk
Factors.
|
13
|
|
Item
1B.
|
Unresolved
Staff Comments.
|
24
|
|
Item
2.
|
Properties.
|
24
|
|
Item
3.
|
Legal
Proceedings.
|
24
|
|
Item
4.
|
Submission
of Matters to a Vote of Security Holders.
|
26
|
|
|
PART
II
|
|
|
Item
5.
|
Market
For Registrant’s Common Equity, Related Stockholder Matters and Issuer
Purchases of Equity Securities.
|
27
|
|
Item
6.
|
Selected
Financial Data.
|
30
|
|
Item
7.
|
Management’s
Discussion and Analysis of Financial Condition and Results of
Operations.
|
31
|
|
Item
7A.
|
Quantitative
and Qualitative Disclosures About Market Risk.
|
49
|
|
Item
8.
|
Financial
Statements and Supplementary Data.
|
51
|
|
Item
9.
|
Changes
in and Disagreements with Accountants on Accounting and Financial
Disclosure.
|
51
|
|
Item
9A.
|
Controls
and Procedures
|
51
|
|
Item
9B.
|
Other
Information.
|
59
|
|
|
PART
III
|
|
|
Item
10.
|
Directors,
Executive Officers and Corporate Governance
|
60
|
|
Item
11.
|
Executive
Compensation
|
60
|
|
Item
12.
|
Security
Ownership of Certain Beneficial Owners and Management and Related
Stockholder Matters
|
60
|
|
Item
13.
|
Certain
Relationships and Related Transactions, and Director
Independence
|
60
|
|
Item
14.
|
Principal
Accounting Fees and Services
|
60
|
|
|
PART
IV
|
|
|
Item
15.
|
Exhibits,
Financial Statement Schedules
|
60
|
|
Index
to Financial Statements
|
F-1
|
|
|
Index
to Exhibits
|
||
|
Signatures
|
||
|
Exhibits
Filed With This Report
|
|
|
|
o
|
Locations
near fuel blending facilities will enable lower ethanol transportation
costs and enjoy timing and logistical advantages over competing locations
requiring ethanol to be shipped over much longer distances.
|
|
o
|
Locations
adjacent to major rail lines will enable the purchase of corn from
major
corn-producing regions for efficient delivery in large-scale trains.
|
|
o
|
Locations
near large concentrations of dairy and/or beef cattle will enable
delivery
of WDG over short distances without the need for costly drying processes.
|
|
Madera
Facility
|
Front
Range
Facility(1)
|
Boardman
Facility(2)
|
California
Facility(2)
|
Imperial
Valley
Facility(2)
|
Magic
Valley
Facility(2)
|
|
|
Location
|
Madera,
CA
|
Windsor,
CO
|
Boardman,
OR
|
TBA
|
Brawley,
CA
|
Burley,
ID
|
|
Quarter/Year
completed or scheduled to be completed
|
4th
Qtr., 2006
|
2nd
Qtr., 2006
|
2nd
Qtr., 2007
|
2nd
Qtr., 2008
|
2nd
Qtr., 2008
|
2nd
Qtr., 2008
|
|
Annual
ethanol nameplate production capacity (in millions of
gallons)
|
35
|
40
|
35
|
50
|
50
|
50
|
|
Ownership
|
100%
|
42%
|
100%
|
100%
|
100%
|
100%
|
|
Primary
energy source
|
Natural
Gas
|
Natural
Gas
|
Natural
Gas
|
Natural
Gas
|
Natural
Gas
|
Natural
Gas
|
|
Estimated
annual WDG production capacity (in thousands of tons)
|
293
|
335
|
293
|
418
|
418
|
418
|
|
·
|
restrictions
on our existing and proposed business operations and/or the need
to
install enhanced or additional controls;
|
|
|
·
|
the
need to obtain and comply with permits and
authorizations;
|
|
|
·
|
liability
for exceeding applicable permit limits or legal requirements, in
certain
cases for the remediation of contaminated soil and groundwater
at our
facilities, contiguous and adjacent properties and other properties
owned
and/or operated by third parties; and
|
|
|
·
|
specifications
for the ethanol we market and
produce.
|
|
·
|
changing
conditions in the ethanol and fuel markets as well as other commodity
markets such as corn;
|
|
|
·
|
the
volume and timing of the receipt of orders for ethanol from major
customers;
|
|
|
·
|
competitive
pricing pressures;
|
|
|
·
|
our
ability to produce, sell and deliver ethanol on a cost-effective
and
timely basis;
|
|
|
·
|
the
introduction and announcement of one or more new alternatives to
ethanol
by our competitors;
|
|
|
·
|
changes
in market valuations of similar companies;
|
|
|
·
|
stock
market price and volume fluctuations generally;
|
|
|
·
|
regulatory
developments or increased enforcement;
|
|
|
·
|
fluctuations
in our quarterly or annual operating results;
|
|
|
·
|
additions
or departures of key personnel;
|
|
|
·
|
our
inability to obtain construction, acquisition, capital equipment
and/or
working capital financing; and
|
|
|
·
|
future
sales of our common stock or other
securities.
|
|
Price
Range
|
||
|
High
|
Low
|
|
|
Year
Ended December 31, 2005:
|
||
|
First
Quarter (January 1 - March 31)
|
$10.25
|
$5.49
|
|
Second
Quarter (April 1 - June 30)
|
12.94
|
8.58
|
|
Third
Quarter (July 1 - September 30)
|
11.20
|
7.78
|
|
Fourth
Quarter (October 1 - December 31)
|
13.48
|
7.71
|
|
Year
Ended December 31, 2006:
|
||
|
First
Quarter
|
$22.34
|
$9.99
|
|
Second
Quarter
|
42.39
|
20.14
|
|
Third
Quarter
|
25.45
|
13.76
|
|
Fourth
Quarter
|
19.08
|
12.58
|
|
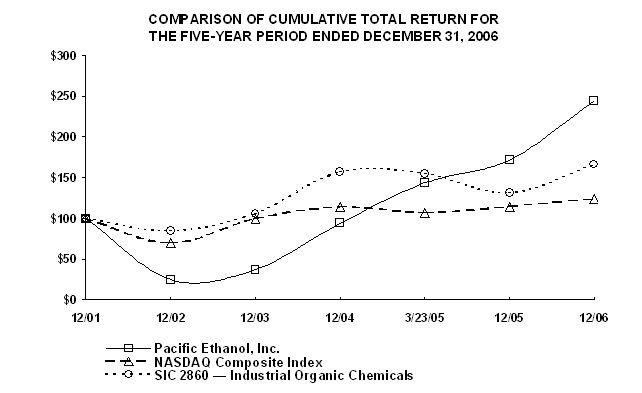
Cumulative
Total Return ($)
|
|||||||
|
12/01
|
12/02
|
12/03
|
12/04
|
3/23/05
|
12/05
|
12/06
|
|
|
PACIFIC
ETHANOL, INC.
|
100.00
|
24.60
|
37.30
|
94.13
|
143.65
|
171.75
|
244.29
|
|
THE
NASDAQ STOCK MARKET (U.S.) INDEX
|
100.00
|
69.66
|
99.71
|
113.79
|
106.87
|
114.47
|
124.20
|
|
SIC
2860—INDUSTRIAL ORGANIC CHEMICALS
|
100.00
|
84.41
|
105.89
|
156.97
|
154.98
|
130.92
|
166.23
|
|
Year
Ended December 31,
|
|||||||||||||
|
2006
|
2005
|
2004
|
2003
|
||||||||||
|
(in
thousands, except per share data)
|
|||||||||||||
|
Consolidated
Statements of Operations Data:
|
|
|
|
||||||||||
|
Net
sales
|
$
|
226,356
|
$
|
87,599
|
$
|
20
|
$
|
1,017
|
|||||
|
Cost
of goods sold
|
201,527
|
84,444
|
13
|
946
|
|||||||||
|
Gross
profit
|
24,829
|
3,155
|
7
|
71
|
|||||||||
|
Selling,
general and administrative expenses
|
24,641
|
12,638
|
2,277
|
648
|
|||||||||
|
Income
(loss) from operations
|
188
|
(9,483
|
)
|
(2,270
|
)
|
(577
|
)
|
||||||
|
Other
income (expense), net
|
3,426
|
(440
|
)
|
(532
|
)
|
(282
|
)
|
||||||
|
Non-controlling
interest in variable interest entity
|
(3,756
|
)
|
—
|
—
|
—
|
||||||||
|
Loss
from operations before income taxes
|
(142
|
)
|
(9,923
|
)
|
(2,802
|
)
|
(859
|
)
|
|||||
|
Provision
for income taxes
|
—
|
—
|
—
|
—
|
|||||||||
|
Net
loss
|
$
|
(142
|
)
|
$
|
(9,923
|
)
|
$
|
(2,802
|
)
|
$
|
(859
|
)
|
|
|
Preferred
stock dividends
|
$
|
(2,998
|
)
|
$
|
—
|
$
|
—
|
$
|
—
|
||||
|
Deemed
dividend on preferred stock
|
(84,000
|
)
|
—
|
—
|
—
|
||||||||
|
Loss
available to common stockholders
|
$
|
(87,140
|
)
|
$
|
(9,923
|
)
|
$
|
(2,802
|
)
|
$
|
(859
|
)
|
|
|
Loss
per common share, basic and diluted
|
$
|
(2.50
|
)
|
$
|
(0.40
|
)
|
$
|
(0.23
|
)
|
$
|
(0.07
|
)
|
|
|
Weighted-average
shares outstanding, basic and diluted
|
34,855
|
25,066
|
12,397
|
11,733
|
|||||||||
|
Consolidated
Balance Sheet Data:
|
|||||||||||||
|
Cash
and cash equivalents
|
$
|
44,053
|
$
|
4,521
|
$
|
—
|
$
|
249
|
|||||
|
Working
capital (deficit)
|
96,451
|
(2,894
|
)
|
(1,025
|
)
|
(358
|
)
|
||||||
|
Total
assets
|
453,820
|
48,185
|
7,179
|
6,560
|
|||||||||
|
Long-term
debt
|
28,970
|
1,995
|
4,013
|
—
|
|||||||||
|
Stockholders’
equity
|
298,445
|
28,516
|
1,356
|
1,368
|
|||||||||
|
·
|
fluctuations
in the market price of ethanol and its co-products;
|
|
·
|
the
projected growth or contraction in the ethanol and co-product market
in
which we operate;
|
|
·
|
our
strategies for expanding, maintaining or contracting our presence
in these
markets;
|
|
·
|
our
ability to successfully develop, finance, construct and operate our
planned ethanol production facilities;
|
|
·
|
anticipated
trends in our financial condition and results of operations;
and
|
|
·
|
our
ability to distinguish ourselves from our current and future competitors.
|
|
·
|
Net
sales. Our
increase in net sales in 2006 as compared to 2005 was primarily due
to the
following combination of factors:
|
|
o
|
Higher
sales volumes.
Total volume of ethanol sold as a principal and an agent increased
by 49.4
million gallons, or 94.5%, to 101.7 million gallons for 2006 from
52.3
million gallons for 2005. The substantial increase in sales volume
is
primarily due to additional supply provided under our ethanol marketing
agreements and the commencement of ethanol production.
|
|
o
|
Commencement
of ethanol production.
In the fourth quarter of 2006, we commenced producing ethanol and
its
co-products at our Madera facility and, based on our ownership interest
in
Front Range, began recording a proportionate amount of its net sales.
The
production and sale of ethanol and its co-products at our Madera
facility
and through Front Range contributed an aggregate of $25.9 million
in sales
for 2006.
|
|
o
|
Higher
ethanol prices.
Our average sales price of ethanol increased by $0.61 per gallon,
or
36.5%, to $2.28 per gallon for all gallons sold as a principal and
an
agent for 2006 as compared to $1.67 per gallon for 2005.
|
|
o
|
Partial
period comparison.
Our results of operations for 2006, including our net sales, include
our
operations and those of all of our wholly-owned subsidiaries, including
Kinergy Marketing, LLC, or Kinergy, for that entire period. However,
our
results of operations for 2005, including our net sales, exclude
Kinergy’s
net sales for the period from January 1, 2005 through March 22, 2005
in
the amount of $23.6 million. See “Share Exchange Transaction”
below.
|
|
·
|
Gross
profit. Our
gross profit margin increased to 10.9% for 2006 as compared to a
gross
profit margin of 3.6% for 2005. This increase was primarily due to
locking
in favorable margins through purchase and sale commitments consistent
with
our risk management guidelines at various times during 2006. The
increase
in our gross profit margins was also due to sales resulting from
ethanol
production, which typically generates higher gross profits than ethanol
marketing arrangements, at our Madera facility and also through Front
Range.
|
| · |
Selling,
general and administrative expenses.
Our selling, general and administrative expenses increased by $12.0
million to $24.6 million in 2006 as compared to $12.6 million in
2005;
however, these expenses decreased as a percentage of our net sales
due to
our substantial growth in net sales. Our selling, general and
administrative expenses decreased to 10.9% of net sales in 2006 as
compared to 14.4% of net sales in 2005.
|
|
·
|
the
market price of ethanol, which we believe will be impacted by the
degree
of competition in the ethanol market, the price of gasoline and related
petroleum products, and government regulation, including tax incentives;
|
|
·
|
the
market price of key production input commodities, including corn
and
natural gas;
|
|
·
|
our
ability to anticipate trends in the market price of ethanol, WDG,
and key
input commodities and implement appropriate risk management and
opportunistic strategies; and
|
|
·
|
the
proportion of our sales of ethanol produced at our facilities to
our sales
of ethanol produced by third-parties.
|
|
·
|
As
a merchant.
Sales as a merchant consist of sales to customers through purchases
from
third-party suppliers in which we may or may not obtain physical
control
of the ethanol or co-products, though ultimately titled to us, in
which
shipments are directed from our suppliers to our terminals or direct
to
our customers but for which we accept the risk of loss in the
transactions.
|
|
·
|
As
a producer.
Sales as a producer consist of sales of our inventory produced at
our
facilities, including by Front
Range.
|
|
·
|
As
an agent.
Sales as an agent consist of sales to customers through purchases
from
third-party suppliers in which, depending upon the terms of the
transactions, title to the product may technically pass to us, but
risk of
loss in the transactions does not since all transacted sales prices
flow
back to our third-party suppliers. When acting as an agent for third-party
suppliers, we conduct back-to-back purchases and sales in which we
match
ethanol purchase and sales contracts of like quantities and delivery
periods. We receive a predetermined service fee under these transactions
and therefore act predominantly in an agency
capacity.
|
|
Cash
and cash equivalents
|
$
|
742
|
||
|
Investments
|
7,058
|
|||
|
Accounts
receivable
|
3,520
|
|||
|
Inventories
|
3,535
|
|||
|
Other
current assets
|
235
|
|||
|
Property
and equipment
|
92,376
|
|||
|
Other
long-term assets
|
584
|
|||
|
Intangibles
- customer backlog
|
3,900
|
|||
|
Intangibles
- non-compete covenants
|
400
|
|||
|
Goodwill
|
80,607
|
|||
|
Current
portion of long-term debt
|
(3,395
|
)
|
||
|
Accounts
payable and accrued expenses
|
(4,591
|
)
|
||
|
Long-term
debt
|
(28,753
|
)
|
||
|
Non-controlling
interest in variable interest entity
|
(90,606
|
)
|
||
|
Net
Assets
|
$
|
65,612
|
|
2006
|
2005
|
||||||
|
Commodity
futures
|
$
|
646
|
$
|
—
|
|||
|
Commodity
options
|
(24
|
)
|
—
|
||||
|
Interest
rate options
|
(17
|
)
|
—
|
||||
|
Total
|
$
|
605
|
$
|
—
|
|||
|
·
|
The
first two data columns in the tables show the absolute results for
each
period presented.
|
|
·
|
The
columns entitled “Dollar Variance” and “Percentage Variance” show the
change in results, both in dollars and percentages. These two columns
show
favorable changes as a positive and unfavorable changes as negative.
For
example, when our net sales increase from one period to the next,
that
change is shown as a positive number in both columns. Conversely,
when
expenses increase from one period to the next, that change is shown
as a
negative in both columns.
|
|
·
|
The
last two columns in the tables show the results for each period as
a
percentage of net sales.
|
|
|
|
|
Year
Ended
|
Dollar
Variance
|
Percentage
Variance
|
Results
as a Percentage
of
Net Sales for the
Year
Ended
|
|||||||||||||
|
December
31,
|
Favorable
|
Favorable
|
December
31,
|
||||||||||||||||
|
2006
|
2005
|
(Unfavorable)
|
(Unfavorable)
|
2006
|
2005
|
||||||||||||||
|
(in
thousands)
|
|||||||||||||||||||
|
Net
sales
|
$
|
226,356
|
$
|
87,599
|
$
|
138,757
|
158.4
|
%
|
100.0
|
%
|
100.0
|
%
|
|||||||
|
Cost
of sales
|
201,527
|
84,444
|
(117,083
|
)
|
(138.6
|
)
|
89.0
|
96.4
|
|||||||||||
|
Gross
profit
|
24,829
|
3,155
|
21,674
|
687.0
|
10.9
|
3.6
|
|||||||||||||
|
Selling,
general and administrative expenses
|
24,641
|
12,638
|
(12,003
|
)
|
(94.9
|
)
|
10.9
|
14.4
|
|||||||||||
|
Income
(loss) from operations
|
188
|
(9,483
|
)
|
9,671
|
101.9
|
0.1
|
(10.8
|
)
|
|||||||||||
|
Other
income (expense), net
|
3,426
|
(440
|
)
|
3,866
|
878.6
|
1.5
|
(0.5
|
)
|
|||||||||||
|
Income
(loss) before non-controlling interest in variable interest
entity
|
3,614
|
(9,923
|
)
|
13,537
|
136.4
|
1.6
|
(11.3
|
)
|
|||||||||||
|
Provision
for income taxes
|
—
|
—
|
—
|
—
|
—
|
—
|
|||||||||||||
|
Non-controlling
interest in variable interest entity
|
(3,756
|
)
|
—
|
(3,756
|
)
|
(100.0
|
)
|
(1.7
|
)
|
—
|
|||||||||
|
Net
loss
|
$
|
(142
|
)
|
$
|
(9,923
|
)
|
$
|
9,781
|
98.6
|
%
|
(0.1
|
)%
|
(11.3
|
)%
|
|||||
|
Preferred
stock dividends
|
(2,998
|
)
|
—
|
(2,998
|
)
|
(100.0
|
)
|
(1.3
|
)
|
—
|
|||||||||
|
Deemed
dividend on preferred stock
|
(84,000
|
)
|
—
|
(84,000
|
)
|
(100.0
|
)
|
(37.1
|
)
|
—
|
|||||||||
|
Loss
available to common stockholders
|
$
|
(87,140
|
)
|
$
|
(9,923
|
)
|
$
|
(77,217
|
)
|
(778.2
|
)%
|
(38.5
|
)%
|
(11.3
|
)%
|
||||
|
Year
Ended
|
Dollar
Variance
|
Percentage
Variance
|
Results
as a Percentage
of
Net Sales for the
Year
Ended
|
||||||||||||||||
|
December
31,
|
Favorable
|
Favorable
|
December
31,
|
||||||||||||||||
|
2005
|
2004
|
(Unfavorable)
|
(Unfavorable)
|
2005
|
2004
|
||||||||||||||
|
(in
thousands)
|
|||||||||||||||||||
|
Net
sales
|
$
|
87,599
|
$
|
20
|
$
|
87,579
|
437,895.0
|
%
|
100.0
|
%
|
100.0
|
%
|
|||||||
|
Cost
of sales
|
84,444
|
13
|
(84,431
|
)
|
(649,469.2
|
)
|
96.4
|
65.0
|
|||||||||||
|
Gross
profit
|
3,155
|
7
|
3,148
|
44,971.4
|
3.6
|
35.0
|
|||||||||||||
|
Selling,
general and administrative expenses
|
10,995
|
2,277
|
(8,718
|
)
|
(382.8
|
)
|
12.6
|
11,385.0
|
|||||||||||
|
Feasibility
study expensed in connection with acquisition of ReEnergy
|
852
|
—
|
(852
|
)
|
(100.0
|
)
|
1.0
|
—
|
|||||||||||
|
Acquisition
cost expense in excess of cash received
|
481
|
—
|
(481
|
)
|
(100.0
|
)
|
0.5
|
—
|
|||||||||||
|
Discontinued
design of cogeneration facility
|
310
|
—
|
(310
|
)
|
(100.0
|
)
|
0.4
|
—
|
|||||||||||
|
Loss
from operations
|
(9,483
|
)
|
(2,270
|
)
|
(7,213
|
)
|
(317.8
|
)
|
(10.8
|
)
|
(11,350.0
|
)
|
|||||||
|
Total
other expense
|
(440
|
)
|
(532
|
)
|
92
|
17.3
|
(0.5
|
)
|
(2,660.0
|
)
|
|||||||||
|
Loss
from operations before income taxes
|
(9,923
|
)
|
(2,802
|
)
|
(7,121
|
)
|
(254.1
|
)
|
(11.3
|
)
|
(14,010.0
|
)
|
|||||||
|
Provision
for income taxes
|
—
|
—
|
—
|
—
|
—
|
—
|
|||||||||||||
|
Net
loss
|
$
|
(9,923
|
)
|
$
|
(2,802
|
)
|
$
|
(7,121
|
)
|
(254.1
|
)
|
(11.3
|
)%
|
(14,010.0
|
)%
|
||||
|
Contractual
Obligations
At
December 31, 2006
|
2007
|
2008
|
2009
|
2010
|
2011
|
Thereafter
|
Total
|
|||||||||||||||
|
Sourcing
commitments(1)
|
$
|
81,945
|
$
|
—
|
$
|
—
|
$
|
—
|
$
|
—
|
$
|
—
|
$
|
81,945
|
||||||||
|
Debt
principal(2)
|
4,030
|
2,910
|
3,158
|
3,425
|
18,359
|
—
|
31,882
|
|||||||||||||||
|
Debt
interest(2)
|
2,831
|
2,597
|
2,344
|
2,070
|
1,773
|
—
|
11,615
|
|||||||||||||||
|
Water
rights - capital lease, including interest(3)
|
160
|
160
|
160
|
160
|
160
|
800
|
1,600
|
|||||||||||||||
|
Operating
leases(4)
|
267
|
203
|
172
|
172
|
110
|
—
|
924
|
|||||||||||||||
|
Firm
capital commitments(5)
|
78,148
|
17,570
|
—
|
—
|
—
|
—
|
95,718
|
|||||||||||||||
|
Preferred
dividends(6)
|
4,200
|
4,200
|
4,200
|
4,200
|
4,200
|
4,200
|
25,200
|
|||||||||||||||
|
|
|
|
|
|
|
|||||||||||||||||
|
Total
commitments
|
$
|
171,581
|
$
|
27,640
|
$
|
10,034
|
$
|
10,027
|
$
|
24,602
|
$
|
5,000
|
$
|
248,884
|
||||||||
| (1) |
Unconditional
purchase commitments for production materials incurred in the normal
course of business.
|
| (2) |
Under
Front Range’s three term loan agreements quarterly payments apply to
accrued interest and principal and mature in 2011, but have required
principal payments based on a ten year amortization schedule. Interest
fluctuates at a premium of 2.75-3.50% based on the 30- or 90-day
LIBOR,
depending on the loan. At December 31, 2006, the 30-day LIBOR was
5.33%
and the 90-day LIBOR was 5.32%.
|
| (3) |
The
water rights lease obligation of Front Range relates to a lease agreement
for water in production processes. The lease requires an initial
payment
of $400,000 and annual payments of $160,000 per year for the next
ten
years. The future payments were discounted using a 5.25% interest
rate.
|
| (4) |
Future
minimum payments under non cancellable operating
leases.
|
| (5) |
Construction
commitments for in-progress and contracted ethanol processing
facilities.
|
| (6) |
Represents
dividends on 5,250,000 shares of Series A Preferred
Stock.
|
|
Commodity
Derivatives
|
Interest
Rate Derivatives
|
||||||
|
Gain/(Loss)*
|
Gain/(Loss)*
|
||||||
|
Beginning
balance, January 1, 2006
|
$
|
—
|
$
|
—
|
|||
|
Net
changes
|
1,307
|
(272
|
)
|
||||
|
Less:
Amount reclassified to revenue
|
1,281
|
—
|
|||||
|
Less:
Amount reclassified to cost of goods sold
|
(435
|
)
|
—
|
||||
|
Less:
Amount reclassified to other income (expense)
|
—
|
(7
|
)
|
||||
|
Ending
balance, December 31, 2006
|
$
|
461
|
$
|
(265
|
)
|
||
|
2006
|
2005
|
||||||
|
Commodity
futures
|
$
|
329
|
$
|
—
|
|||
|
Interest
rate options
|
125
|
—
|
|||||
|
Total
|
$
|
454
|
$
|
—
|
|||
|
(i)
|
pertain
to the maintenance of records that, in reasonable detail, accurately
and
fairly reflect the transactions and dispositions of our
assets;
|
|
(ii)
|
provide
reasonable assurance that transactions are recorded as necessary
to permit
preparation of financial statements in accordance with generally
accepted
accounting principles, and that our receipts and expenditures are
being
made only in accordance with authorizations of our management and
directors; and
|
|
(iii)
|
provide
reasonable assurance regarding prevention or timely detection of
unauthorized acquisition, use or disposition of our assets that could
have
a material affect on our financial
statements.
|
|
(1)
|
We
had not effectively implemented comprehensive entity-level internal
controls.
|
|
(2)
|
We
did not have a sufficient complement of personnel with appropriate
training and experience in generally accepted accounting principals,
or
GAAP.
|
|
(3)
|
We
did not adequately segregate the duties of different personnel within
our
accounting group due to an insufficient complement of staff.
|
|
(4)
|
We
did not perform adequate oversight of certain accounting functions
and
maintained inadequate documentation of management review and approval
of
accounting transactions and financial reporting
processes.
|
|
(5)
|
We
did not have adequate controls governing major account invoice processing
and payment.
|
|
(6)
|
We
had not fully implemented certain control activities and capabilities
included in the design of our enterprise resource platform, or ERP,
system.
|
|
(7)
|
We
did not have adequate access and data and formulaic integrity controls
over critical spreadsheets used in connection with accounting and
financial reporting.
|
|
(1)
|
The
Company had not effectively implemented comprehensive entity-level
internal controls;
|
|
(2)
|
The
Company did not have a sufficient complement of personnel with appropriate
training and experience in generally accepted accounting principles,
or
GAAP;
|
|
(3)
|
The
Company did not adequately segregate the duties of different personnel
within its accounting group due to an insufficient complement of
staff;
|
|
(4)
|
The
Company did not perform adequate oversight of certain accounting
functions
and maintained inadequate documentation of management review and
approval
of accounting transactions and financial reporting
processes;
|
|
(5)
|
The
Company did not have adequate controls governing major account invoice
processing and payment;
|
|
(6)
|
The
Company did not fully implement certain control activities and
capabilities included in the design of its enterprise resource platform,
or ERP system; and
|
|
(7)
|
The
Company did not maintain adequate access and data and formulaic integrity
controls over critical spreadsheets used in connection with accounting
and
financial reporting.
|
|
Report
of Independent Registered Public Accounting Firm
|
F-2
|
|
Consolidated
Balance Sheets as of December 31, 2006 and 2005
|
F-3
|
|
Consolidated
Statements of Operations for the Years Ended December 31, 2006, 2005
and 2004
|
F-5
|
|
Consolidated
Statements of Comprehensive Income (Loss) for the Years Ended
December 31, 2006, 2005 and 2004
|
F-6
|
|
Consolidated
Statement of Stockholders’ Equity for the Years Ended December 31,
2006, 2005 and 2004
|
F-7
|
|
Consolidated
Statements of Cash Flows for the Years Ended December 31, 2006, 2005
and 2004
|
F-10
|
|
Notes
to Consolidated Financial Statements
|
F-12
|
|
December
31,
|
|||||||
|
ASSETS
|
2006
|
2005
|
|||||
|
Current
Assets:
|
|||||||
|
Cash
and cash equivalents
|
$
|
44,053
|
$
|
4,521
|
|||
|
Investments
in marketable securities
|
39,119
|
2,750
|
|||||
|
Accounts
receivable, net (including $1,188 and $938 as
of
December 31, 2006 and 2005,
respectively,
from a related party)
|
29,322
|
4,948
|
|||||
|
Restricted
cash
|
1,567
|
—
|
|||||
|
Notes
receivable - related party
|
—
|
136
|
|||||
|
Inventories
|
7,595
|
363
|
|||||
|
Prepaid
expenses
|
1,053
|
627
|
|||||
|
Prepaid
inventory
|
2,029
|
1,349
|
|||||
|
Other
current assets
|
2,307
|
86
|
|||||
|
Total
current assets
|
127,045
|
14,780
|
|||||
|
Property
and Equipment, Net
|
196,156
|
23,208
|
|||||
|
Other
Assets:
|
|||||||
|
Restricted
cash
|
24,851
|
—
|
|||||
|
Deposits
and advances
|
9,040
|
14
|
|||||
|
Goodwill
|
85,307
|
2,566
|
|||||
|
Intangible
assets, net
|
10,155
|
7,569
|
|||||
|
Other
assets
|
1,266
|
48
|
|||||
|
Total
other assets
|
130,619
|
10,197
|
|||||
|
Total
Assets
|
$
|
453,820
|
$
|
48,185
|
|||
|
December
31,
|
|||||||
|
LIABILITIES
AND STOCKHOLDERS’ EQUITY
|
2006
|
2005
|
|||||
|
Current
Liabilities:
|
|||||||
|
Current
portion - related party note payable
|
$
|
—
|
$
|
1,200
|
|||
|
Current
portion - notes payable
|
4,125
|
—
|
|||||
|
Accounts
payable - trade
|
11,483
|
4,755
|
|||||
|
Accounts
payable - related party
|
3,884
|
6,412
|
|||||
|
Accrued
retention - related party
|
5,538
|
1,450
|
|||||
|
Accrued
payroll
|
766
|
434
|
|||||
|
Other
accrued liabilities
|
4,798
|
3,423
|
|||||
|
Total
current liabilities
|
30,594
|
17,674
|
|||||
|
Related-party
notes payable, net of current portion
|
—
|
1,995
|
|||||
|
Notes
payable, net of current portion
|
28,970
|
—
|
|||||
|
Deferred
tax liability
|
1,091
|
—
|
|||||
|
Other
liabilities
|
357
|
—
|
|||||
|
Total
Liabilities
|
61,012
|
19,669
|
|||||
|
Commitments
and Contingencies (Notes 2, 9, 15, 16 and 18)
|
|||||||
|
Non-controlling
interest in variable interest entity
|
94,363
|
—
|
|||||
|
Stockholders’
Equity:
|
|||||||
|
Preferred
stock, $0.001 par value; 10,000 shares authorized; 5,250 and 0 shares
issued and outstanding as of December 31,
2006 and 2005, respectively
|
5
|
—
|
|||||
|
Common
stock, $0.001 par value; 100,000 shares authorized; 40,269 and 28,874
shares issued and outstanding as of December 31, 2006 and 2005,
respectively
|
40
|
29
|
|||||
|
Additional
paid-in capital
|
397,535
|
42,071
|
|||||
|
Other
comprehensive income
|
545
|
—
|
|||||
|
Accumulated
deficit
|
(99,680
|
)
|
(13,584
|
)
|
|||
|
Total
stockholders’ equity
|
298,445
|
28,516
|
|||||
|
Total
Liabilities and Stockholders’ Equity
|
$
|
453,820
|
$
|
48,185
|
|||
|
Years
Ended December 31,
|
||||||||||
|
2006
|
2005
|
2004
|
||||||||
|
Net
sales (including $16,985, $9,060, and $0 for the years ended
December 31, 2006, 2005 and 2004, respectively, to a related
party)
|
$
|
226,356
|
$
|
87,599
|
$
|
20
|
||||
|
Cost
of goods sold
|
201,527
|
84,444
|
13
|
|||||||
|
Gross
profit
|
24,829
|
3,155
|
7
|
|||||||
|
Selling,
general and administrative expenses
|
24,641
|
12,638
|
2,277
|
|||||||
|
Income
(loss) from operations
|
188
|
(9,483
|
)
|
(2,270
|
)
|
|||||
|
Other
income (expense), net
|
3,426
|
(440
|
)
|
(532
|
)
|
|||||
|
Income
(loss) before provision for income taxes and non-controlling interest
in
variable interest entity
|
3,614
|
(9,923
|
)
|
(2,802
|
)
|
|||||
|
Provision
for income taxes
|
—
|
—
|
—
|
|||||||
|
Income
(loss) before non-controlling interest in variable interest entity
|
3,614
|
(9,923
|
)
|
(2,802
|
)
|
|||||
|
Non-controlling
interest in variable interest entity
|
(3,756
|
)
|
—
|
—
|
||||||
|
Net
loss
|
$
|
(142
|
)
|
$
|
(9,923
|
)
|
$
|
(2,802
|
)
|
|
|
Preferred
stock dividends
|
$
|
(2,998
|
)
|
$
|
—
|
$
|
—
|
|||
|
Deemed
dividend on preferred stock
|
(84,000
|
)
|
—
|
—
|
||||||
|
Loss
available to common stockholders
|
$
|
(87,140
|
)
|
$
|
(9,923
|
)
|
$
|
(2,802
|
)
|
|
|
Net
loss per share, basic and diluted
|
$
|
(2.50
|
)
|
$
|
(0.40
|
)
|
$
|
(0.23
|
)
|
|
|
Weighted-average
shares outstanding, basic and diluted
|
34,855
|
25,066
|
12,397
|
|||||||
|
For
the Years Ended December 31,
|
||||||||||
|
2006
|
2005
|
2004
|
||||||||
|
Net
loss
|
$
|
(142
|
)
|
$
|
(9,923
|
)
|
$
|
(2,802
|
)
|
|
|
Other
comprehensive income, net of tax:
|
||||||||||
|
Cash
flow hedges:
|
||||||||||
|
Net
change in the fair value of derivatives, net of tax
|
196
|
—
|
—
|
|||||||
|
Unrealized
gain on restricted available-for-sale securities
|
349
|
—
|
—
|
|||||||
|
Comprehensive
income (loss)
|
$
|
403
|
$
|
(9,923
|
)
|
$
|
(2,802
|
)
|
||
|
Preferred
Stock
|
Common
Stock
|
Additional
Paid-In
Capital
|
Other
Compre-
hensive
Income
|
Accumulated
Deficit
|
Total
|
||||||||||||||||||||
|
Shares
|
Amount
|
Shares
|
Amount
|
||||||||||||||||||||||
|
Balances,
January 1, 2004
|
—
|
$
|
—
|
11,733
|
$
|
12
|
$
|
2,215
|
$
|
—
|
$
|
(859
|
)
|
$
|
1,368
|
||||||||||
|
Issuance
of common stock to friends and family, net of offering costs of
$7
|
—
|
—
|
19
|
—
|
21
|
—
|
—
|
21
|
|||||||||||||||||
|
Issuance
of warrants to purchase 920 shares of common stock for non-cash
compensation to non-employee for services
|
—
|
—
|
—
|
—
|
1,380
|
—
|
—
|
1,380
|
|||||||||||||||||
|
Exercise
of warrants
|
—
|
—
|
920
|
1
|
(1
|
)
|
—
|
—
|
—
|
||||||||||||||||
|
Issuance
of common stock in working capital round, net of offering costs
of $107
|
—
|
—
|
500
|
—
|
825
|
—
|
—
|
825
|
|||||||||||||||||
|
Issuance
of common stock in working capital round, net of offering costs
of
$2
|
—
|
—
|
104
|
—
|
309
|
—
|
—
|
309
|
|||||||||||||||||
|
Conversion
of LDI debt
|
—
|
—
|
170
|
—
|
255
|
—
|
—
|
255
|
|||||||||||||||||
|
Comprehensive
loss
|
—
|
—
|
—
|
—
|
—
|
—
|
(2,802
|
)
|
(2,802
|
)
|
|||||||||||||||
|
Balances,
December 31, 2004
|
—
|
$
|
—
|
13,446
|
$
|
13
|
$
|
5,004
|
$
|
—
|
$
|
(3,661
|
)
|
$
|
1,356
|
||||||||||
|
Preferred
Stock
|
Common
Stock
|
Additional
Paid-In
Capital
|
Other
Compre-
hensive
Income
|
Accumulated
Deficit
|
Total
|
||||||||||||||||||||
|
Shares
|
Amount
|
Shares
|
Amount
|
||||||||||||||||||||||
|
Balances,
January 1, 2005
|
—
|
—
|
13,446
|
$
|
13
|
$
|
5,004
|
$
|
—
|
$
|
(3,661
|
)
|
$
|
1,356
|
|||||||||||
|
Amounts
received from shareholder
|
—
|
—
|
—
|
—
|
67
|
—
|
—
|
67
|
|||||||||||||||||
|
Issuance
of shares in private placement, net of offering costs of
$2,125
|
—
|
—
|
7,000
|
7
|
18,868
|
—
|
—
|
18,875
|
|||||||||||||||||
|
Share
Exchange
|
—
|
—
|
7,090
|
7
|
13,577
|
—
|
—
|
13,584
|
|||||||||||||||||
|
Acquisition
costs in excess of cash acquired
|
—
|
—
|
—
|
—
|
481
|
—
|
—
|
481
|
|||||||||||||||||
|
Compensation
expense related to issuance of warrants for consulting
services
|
—
|
—
|
—
|
—
|
927
|
—
|
—
|
927
|
|||||||||||||||||
|
Stock
issued for exercise of warrants for cash
|
—
|
—
|
237
|
—
|
490
|
—
|
—
|
490
|
|||||||||||||||||
|
Stock
issued in cashless exercise of warrants
|
—
|
—
|
34
|
—
|
—
|
—
|
—
|
—
|
|||||||||||||||||
|
Compensation
expense for options issued to employees
|
—
|
—
|
—
|
—
|
80
|
—
|
—
|
80
|
|||||||||||||||||
|
Compensation
expense for employee option converted into a warrant
|
—
|
—
|
—
|
—
|
233
|
—
|
—
|
233
|
|||||||||||||||||
|
Stock
issued for exercise of stock options for cash
|
—
|
—
|
78
|
—
|
450
|
—
|
—
|
450
|
|||||||||||||||||
|
Stock
issued for cashless exercise of stock options
|
—
|
—
|
89
|
1
|
(1
|
)
|
—
|
—
|
—
|
||||||||||||||||
|
Issuance
of stock to employees
|
—
|
—
|
70
|
—
|
651
|
—
|
—
|
651
|
|||||||||||||||||
|
Conversion
of LDI debt
|
—
|
—
|
830
|
1
|
1,244
|
—
|
—
|
1,245
|
|||||||||||||||||
|
Comprehensive
loss
|
—
|
—
|
—
|
—
|
—
|
—
|
(9,923
|
)
|
(9,923
|
)
|
|||||||||||||||
|
Balances,
December 31, 2005
|
—
|
$
|
—
|
28,874
|
$
|
29
|
$
|
42,071
|
$
|
—
|
$
|
(13,584
|
)
|
$
|
28,516
|
||||||||||
|
Preferred
Stock
|
Common
Stock
|
Additional
Paid-In
Capital
|
Other
Compre-
hensive
Income
|
Accumulated
Deficit
|
Total
|
||||||||||||||||||||
|
Shares
|
Amount
|
Shares
|
Amount
|
||||||||||||||||||||||
|
Balances,
January 1, 2006
|
—
|
$
|
—
|
28,874
|
$
|
29
|
$
|
42,071
|
$
|
—
|
$
|
(13,584
|
)
|
$
|
28,516
|
||||||||||
|
Cumulative
effect adjustment (Note 11)
|
—
|
—
|
—
|
—
|
—
|
—
|
1,043
|
1,043
|
|||||||||||||||||
|
Issuance
of preferred stock, net of offering costs of $1,434
|
5,250
|
5
|
—
|
—
|
82,561
|
—
|
—
|
82,566
|
|||||||||||||||||
|
Beneficial
conversion feature on issuance of preferred stock and preferred
dividend
declared
|
—
|
—
|
—
|
—
|
84,000
|
—
|
(86,998
|
)
|
(2,998
|
)
|
|||||||||||||||
|
Issuance
of common stock for private investment in public equity, net of
offering
costs of $7,381
|
—
|
—
|
5,497
|
5
|
137,614
|
—
|
—
|
137,619
|
|||||||||||||||||
|
Exercise
of warrants and Accessity options
|
—
|
—
|
71
|
—
|
89
|
—
|
—
|
89
|
|||||||||||||||||
|
Share-based
compensation expense - restricted stock to employees and
directors
|
—
|
—
|
894
|
1
|
3,047
|
—
|
—
|
3,048
|
|||||||||||||||||
|
Common
stock issued for purchase of 42% interest in Front Range
|
—
|
—
|
2,082
|
2
|
30,006
|
—
|
—
|
30,008
|
|||||||||||||||||
|
Fair
value of warrants issued for purchase of 42% interest in Front
Range
|
—
|
—
|
—
|
—
|
5,087
|
—
|
—
|
5,087
|
|||||||||||||||||
|
Collection
of stockholder receivable
|
—
|
—
|
—
|
—
|
1
|
—
|
—
|
1
|
|||||||||||||||||
|
Share-based
compensation expense - options and warrants to employees and
consultants
|
—
|
—
|
—
|
—
|
3,201
|
—
|
—
|
3,201
|
|||||||||||||||||
|
Stock
issued for exercise of warrants for cash
|
—
|
—
|
2,518
|
3
|
8,556
|
—
|
—
|
8,559
|
|||||||||||||||||
|
Stock
issued in cashless exercise of warrants
|
—
|
—
|
150
|
—
|
—
|
—
|
—
|
—
|
|||||||||||||||||
|
Stock
issued for exercise of stock options for cash
|
—
|
—
|
183
|
—
|
1,303
|
—
|
—
|
1,303
|
|||||||||||||||||
|
Comprehensive
income
|
—
|
—
|
—
|
—
|
—
|
545
|
(142
|
)
|
403
|
||||||||||||||||
|
Balances,
December 31, 2006
|
5,250
|
$
|
5
|
40,269
|
$
|
40
|
$
|
397,536
|
$
|
545
|
$
|
(99,681
|
)
|
$
|
298,445
|
||||||||||
|
For
the Years Ended December 31,
|
||||||||||
|
2006
|
2005
|
2004
|
||||||||
|
Operating
Activities:
|
||||||||||
|
Net
loss
|
$
|
(142
|
)
|
$
|
(9,923
|
)
|
$
|
(2,802
|
)
|
|
|
Adjustments
to reconcile net loss to cash
provided by (used in) operating activities:
|
||||||||||
|
Depreciation
and amortization of intangibles
|
3,998
|
766
|
79
|
|||||||
|
Amortization
of deferred financing fees
|
1,069
|
21
|
20
|
|||||||
|
Interest
expense relating to amortization of debt discount
|
404
|
428
|
240
|
|||||||
|
Discontinued
design of cogeneration facility
|
—
|
311
|
—
|
|||||||
|
Non-cash
compensation expense
|
4,466
|
963
|
—
|
|||||||
|
Non-cash
consulting expense
|
1,782
|
1,099
|
1,207
|
|||||||
|
Expiration
of option acquired in acquisition of ReEnergy
|
—
|
120
|
—
|
|||||||
|
Feasibility
study expensed in connection with acquisition of ReEnergy
|
—
|
852
|
—
|
|||||||
|
Acquisition
cost expense in excess of cash received
|
—
|
481
|
—
|
|||||||
|
Gain/loss
on cash flow hedges
|
162
|
—
|
—
|
|||||||
|
Non-controlling
interest in variable interest entity
|
3,756
|
—
|
—
|
|||||||
|
Bad
debt expense
|
83
|
—
|
—
|
|||||||
|
Changes
in operating assets and liabilities:
|
—
|
|||||||||
|
Accounts
receivable
|
(20,939
|
)
|
(2,427
|
)
|
15
|
|||||
|
Increase
in restricted cash
|
(1,570
|
)
|
—
|
—
|
||||||
|
Notes
receivable, related party
|
136
|
(131
|
)
|
(5
|
)
|
|||||
|
Inventories
|
(3,697
|
)
|
219
|
2
|
||||||
|
Prepaid
expenses and other assets
|
(1,030
|
)
|
(515
|
)
|
(99
|
)
|
||||
|
Prepaid
inventory
|
(679
|
)
|
(1,042
|
)
|
—
|
|||||
|
Other
receivable
|
—
|
(22
|
)
|
263
|
||||||
|
Accounts
payable and accrued expenses
|
2,498
|
7,242
|
250
|
|||||||
|
Accounts
payable, and accrued expenses (related party)
|
1,559
|
5,565
|
396
|
|||||||
|
Net
cash provided by (used in) operating activities
|
(8,144
|
)
|
4,007
|
(434
|
)
|
|||||
|
Investing
Activities:
|
||||||||||
|
Additions
to property and equipment
|
(82,454
|
)
|
(17,273
|
)
|
(740
|
)
|
||||
|
Advances
on equipment
|
(9,041
|
)
|
—
|
—
|
||||||
|
Proceeds
from sales of available-for-sale investments
|
—
|
12,250
|
—
|
|||||||
|
Purchases
of available-for-sale investments
|
(28,962
|
)
|
(15,000
|
)
|
—
|
|||||
|
Payment
on deposit
|
—
|
(14
|
)
|
—
|
||||||
|
Net
cash acquired in acquisition of Kinergy, ReEnergy and
Accessity
|
—
|
3,327
|
—
|
|||||||
|
Cash
payments in connection with share exchange transaction
|
—
|
(541
|
)
|
(430
|
)
|
|||||
|
Payments
received on related party note receivable
|
—
|
—
|
200
|
|||||||
|
Acquisition
of 42% interest in Front Range, net of cash received
|
(29,514
|
)
|
—
|
—
|
||||||
|
Increase
in restricted cash designated for construction projects
|
(24,851
|
)
|
—
|
—
|
||||||
|
Net
cash used in investing activities
|
(174,822
|
)
|
(17,251
|
)
|
(970
|
)
|
||||
|
For
the Years Ended December 31,
|
||||||||||
|
2006
|
2005
|
2004
|
||||||||
|
Financing
Activities:
|
||||||||||
|
Proceeds
from sale of common stock, net
|
137,619
|
18,875
|
1,155
|
|||||||
|
Proceeds
from sale of preferred stock, net
|
82,566
|
—
|
—
|
|||||||
|
Payment
on notes payable, Kinergy and ReEnergy
|
—
|
(2,097
|
)
|
—
|
||||||
|
Proceeds
from notes payable, related party
|
—
|
280
|
—
|
|||||||
|
Payment
on notes payable, related party
|
—
|
(300
|
)
|
—
|
||||||
|
Proceeds
from exercise of warrants and stock options
|
9,951
|
939
|
—
|
|||||||
|
Principal
payments paid on borrowings
|
(1,005
|
)
|
—
|
—
|
||||||
|
Principal
payments paid on borrowings (related party)
|
(3,600
|
)
|
—
|
—
|
||||||
|
Cash
paid for debt issuance costs
|
(3,036
|
)
|
—
|
—
|
||||||
|
Proceeds
from borrowing
|
1,950
|
—
|
—
|
|||||||
|
Preferred
share dividend paid
|
(1,948
|
)
|
—
|
—
|
||||||
|
Receipt
of stockholder receivable
|
1
|
68
|
—
|
|||||||
|
Net
cash provided by financing activities
|
222,498
|
17,765
|
1,155
|
|||||||
|
Net
increase in cash and cash equivalents
|
39,532
|
4,521
|
(249
|
)
|
||||||
|
Cash
and cash equivalents at beginning of period
|
4,521
|
—
|
249
|
|||||||
|
Cash
and cash equivalents at end of period
|
$
|
44,053
|
$
|
4,521
|
—
|
|||||
|
Supplemental
Information:
|
||||||||||
|
Interest
paid
|
$
|
966
|
$
|
387
|
$
|
422
|
||||
|
Non-Cash
Financing and Investing activities:
|
||||||||||
|
Change
in fair value of derivative instruments
|
$
|
196
|
$
|
—
|
$
|
—
|
||||
|
Preferred
stock dividend declared
|
$
|
1,050
|
$
|
—
|
$
|
—
|
||||
|
Deemed
dividend on preferred stock (Note 14)
|
$
|
84,000
|
$
|
—
|
$
|
—
|
||||
|
Unrealized
gain on restricted available-for-sale securities
|
$
|
349
|
$
|
—
|
$
|
—
|
||||
|
Transaction
costs associated with acquisition of 42% interest in Front
Range
|
$
|
304
|
$
|
—
|
$
|
—
|
||||
|
Issuance
of common stock associated with acquisition of 42% interest in Front
Range
|
$
|
30,008
|
$
|
—
|
$
|
—
|
||||
|
Issuance
of warrant associated with acquisition of 42% interest in Front
Range
|
$
|
5,087
|
$
|
—
|
$
|
—
|
||||
|
Cumulative
effect adjustment (Note 11)
|
$
|
2,134
|
$
|
—
|
$
|
—
|
||||
|
Conversion
of debt to equity
|
$
|
—
|
$
|
1,245
|
$
|
255
|
||||
|
Issuance
of stock for receivable
|
$
|
—
|
$
|
—
|
$
|
67
|
||||
|
Purchase
of ReEnergy with stock
|
$
|
—
|
$
|
316
|
$
|
—
|
||||
|
Shares
contributed by stockholder in purchase of ReEnergy
|
$
|
—
|
$
|
506
|
$
|
—
|
||||
|
Shares
contributed by stockholder in purchase of Kinergy
|
$
|
—
|
$
|
1,012
|
$
|
—
|
||||
|
Purchase
of Kinergy with stock
|
$
|
—
|
$
|
9,804
|
$
|
—
|
||||
|
1.
|
ORGANIZATION,
SIGNIFICANT ACCOUNTING POLICIES
AND RECENT ACCOUNTING
PRONOUNCEMENTS.
|
|
2006
|
2005
|
2004
|
|||
|
Customer
A
|
13%
|
18%
|
0%
|
||
|
Customer
B
|
12%
|
11%
|
0%
|
||
|
Customer
C
|
8%
|
10%
|
0%
|
||
|
Customer
D
|
0%
|
0%
|
36%
|
||
|
Customer
E
|
0%
|
0%
|
25%
|
||
|
Customer
F
|
0%
|
0%
|
22%
|
||
|
Customer
G
|
0%
|
0%
|
15%
|
|
2006
|
2005
|
2004
|
|||
|
Supplier
A
|
17%
|
22%
|
0%
|
||
|
Supplier
B
|
5%
|
20%
|
0%
|
||
|
Supplier
C
|
11%
|
17%
|
0%
|
||
|
Supplier
D
|
22%
|
9%
|
0%
|
|
2006
|
2005
|
||||||
|
Raw
materials
|
$
|
3,709
|
$
|
—
|
|||
|
Work
in progress
|
873
|
—
|
|||||
|
Finished
goods
|
2,452
|
—
|
|||||
|
Other
|
561
|
363
|
|||||
|
Total
|
$
|
7,595
|
$
|
363
|
|||
|
Buildings
|
40
years
|
|
Site
improvements and utilities
|
25
years
|
|
Facilities
and plant equipment
|
10
- 25 years
|
|
Other
equipment and vehicles
|
7
-
10 years
|
|
Office
furniture, fixtures and equipment
|
5
-
10 years
|
|
Water
rights
|
99
years
|
|
Year
Ended December 31,
|
||||||||||
|
2006
|
2005
|
2004
|
||||||||
|
Numerator
(basic and diluted):
|
||||||||||
|
Net
loss
|
$
|
(142
|
)
|
$
|
(9,923
|
)
|
$
|
(2,802
|
)
|
|
|
Preferred
stock dividends
|
(2,998
|
)
|
—
|
—
|
||||||
|
Deemed
dividend on preferred stock
|
(84,000
|
)
|
—
|
—
|
||||||
|
Loss
available to common stockholders
|
(87,140
|
)
|
(9,923
|
)
|
(2,802
|
)
|
||||
|
Denominator:
|
||||||||||
|
Weighted-average
common shares outstanding
- basic and diluted
|
34,855
|
25,066
|
12,397
|
|||||||
|
Net
loss per share - basic and diluted
|
$
|
(2.50
|
)
|
$
|
(0.40
|
)
|
$
|
(0.23
|
)
|
|
| · |
As
a merchant.
Sales as a merchant consist of sales to customers through purchases
from
third-party suppliers in which the Company may or may not obtain
physical
control of the ethanol or co-products, though ultimately titled to the
Company, in which shipments are directed from the Company’s suppliers to
its terminals or direct to its customers but for which the Company
accepts
the risk of loss in the
transactions.
|
| · |
As
a producer.
Sales as a producer consist of sales of the Company’s inventory produced
at its facilities, including by Front
Range.
|
| · |
As
an agent.
Sales as an agent consist of sales to customers through purchases
from
third-party suppliers in which, depending upon the terms of the
transactions, title to the product may technically pass to the Company,
but risk of loss in the transactions does not since all transacted
sales
prices flow back to the Company’s third-party suppliers. When acting as an
agent for third-party suppliers, the Company conducts back-to-back
purchases and sales in which it match ethanol purchase and sales
contracts
of like quantities and delivery periods. The Company receives a
predetermined service fee under these transactions and therefore
acts
predominantly in an agency capacity.
|
|
2.
|
BUSINESS
COMBINATIONS.
|
|
Current
Assets:
|
||||
|
Cash
|
$
|
742
|
||
|
Investments
|
7,058
|
|||
|
Receivables
|
3,520
|
|||
|
Inventories
|
3,535
|
|||
|
Other
current assets
|
235
|
|||
|
Total
Current Assets
|
15,090
|
|||
|
Property
and Equipment
|
92,376
|
|||
|
Other
Assets
|
584
|
|||
|
Intangible
Assets:
|
||||
|
Customer
backlogs
|
3,900
|
|||
|
Non-compete
covenants
|
400
|
|||
|
Goodwill
|
80,607
|
|||
|
Total
Intangible Assets
|
84,907
|
|||
|
Total
Assets
|
192,957
|
|||
|
Current
Liabilities:
|
||||
|
Current
portion of long-term debt
|
(3,395
|
)
|
||
|
Accounts
payable and accrued expenses
|
(4,591
|
)
|
||
|
Total
Current Liabilities
|
(7,986
|
)
|
||
|
Long
Term Debt
|
(28,753
|
)
|
||
|
Total
Liabilities
|
(36,739
|
)
|
||
|
Non-controlling
interest in variable interest entity
|
(90,606
|
)
|
||
|
Net
Assets
|
65,612
|
|||
|
Cash
issued to Eagle Energy
|
30,000
|
|||
|
Stock
issued to Eagle Energy
|
30,008
|
|||
|
Value
of warrant issued to Eagle Energy
|
5,087
|
|||
|
Acquisition
expenses
|
517
|
|||
|
Transaction
value
|
65,612
|
|||
|
Accessity
March
23, 2005
|
Kinergy
March
23, 2005
|
ReEnergy
March
23, 2005
|
Total
|
||||||||||
|
Current
Assets
|
|||||||||||||
|
Cash
|
$
|
2,870
|
$
|
454
|
$
|
3
|
$
|
3,327
|
|||||
|
Other
current assets
|
—
|
3,407
|
-
|
3,407
|
|||||||||
|
Total
Current Assets
|
2,870
|
3,861
|
3
|
6,734
|
|||||||||
|
Property
and Equipment
|
—
|
7
|
—
|
7
|
|||||||||
|
Other
Assets
|
|||||||||||||
|
Land
option
|
—
|
—
|
120
|
120
|
|||||||||
|
Intangible
Assets
|
|||||||||||||
|
Distribution
backlog
|
—
|
136
|
—
|
136
|
|||||||||
|
Customer
relations
|
—
|
4,741
|
—
|
4,741
|
|||||||||
|
Non-compete
|
—
|
695
|
—
|
695
|
|||||||||
|
Trade
name
|
—
|
2,678
|
—
|
2,678
|
|||||||||
|
Goodwill
(Note 11)
|
—
|
2,566
|
—
|
2,566
|
|||||||||
|
Total
Intangible Assets
|
—
|
10,816
|
—
|
10,816
|
|||||||||
|
Total
Assets
|
2,870
|
14,684
|
123
|
17,677
|
|||||||||
|
Current
Liabilities
|
|||||||||||||
|
Accounts
payable and accrued expenses
|
139
|
1,772
|
1
|
1,912
|
|||||||||
|
Amount
due to Cagan McAfee
|
83
|
—
|
—
|
83
|
|||||||||
|
Due
to Kinergy/ReEnergy Members
|
—
|
2,096
|
2
|
2,098
|
|||||||||
|
Total
Current Liabilities
|
222
|
3,868
|
3
|
4,093
|
|||||||||
|
Net
Assets
|
$
|
2,648
|
$
|
10,816
|
$
|
120
|
$
|
13,584
|
|||||
|
Expense
for services rendered in connection with feasibility study
|
$
|
—
|
$
|
—
|
$
|
852
|
$
|
852
|
|||||
|
Stock
Issued
|
2,339
|
3,875
|
125
|
6,339
|
|||||||||
|
Stock
issued to Accessity officers
|
600
|
—
|
—
|
600
|
|||||||||
|
Stock
Issued as finders fee
|
150
|
—
|
—
|
150
|
|||||||||
|
Total
Stock Issued
|
3,089
|
3,875
|
125
|
7,089
|
|||||||||
|
March
23, 2005
|
||||
|
Backlog
|
$
|
136
|
||
|
Customer
relationships
|
4,741
|
|||
|
Non-compete
|
695
|
|||
|
Kinergy
trade name
|
2,678
|
|||
|
Goodwill
(Note 11)
|
2,566
|
|||
|
Total
assets acquired
|
$
|
10,816
|
||
|
Year
Ended December 31,
|
||||||||||
|
2006
|
2005(1)
|
2004
|
||||||||
|
Net
sales
|
$
|
244,046
|
$
|
111,187
|
$
|
82,810
|
||||
|
Net
income (loss)
|
$
|
7,026
|
$
|
(13,095
|
)
|
(6,559
|
)
|
|||
|
Preferred
stock dividends
|
$
|
(2,998
|
)
|
$
|
—
|
$
|
—
|
|||
|
Deemed
dividend on preferred stock
|
(84,000
|
)
|
—
|
—
|
||||||
|
Loss
available to common stockholders
|
(79,972
|
)
|
(13,095
|
)
|
(6,559
|
)
|
||||
|
Basic
loss per share of common stock
|
$
|
(2.30
|
)
|
$
|
(0.52
|
)
|
$
|
(0.53
|
)
|
|
| (1) |
Front
Range’s ethanol production facility became operational in June 2006 and
accordingly, no sales revenues and only administrative expenses were
incurred during 2005 and 2004.
|
|
3.
|
CONSOLIDATION
OF VARIABLE-INTEREST ENTITY.
|
|
4.
|
MARKETABLE
SECURITIES.
|
|
Cost
|
Gross
Unrealized Gains
|
Gross
Unrealized (Losses)
|
Fair
Value
|
||||||||||
|
2006:
|
|||||||||||||
|
Available-for-sale:
|
|||||||||||||
|
U.S.
Treasury securities
|
$
|
27,651
|
$
|
349
|
$
|
—
|
$
|
28,000
|
|||||
|
Other
short-term marketable securities
|
11,119
|
—
|
—
|
11,119
|
|||||||||
|
Total
marketable securities
|
$
|
38,770
|
$
|
349
|
$
|
—
|
$
|
39,119
|
|||||
|
2005:
|
|||||||||||||
|
Available-for-sale:
|
|||||||||||||
|
Auction
Rate securities
|
$
|
2,750
|
$
|
—
|
$
|
—
|
$
|
2,750
|
|||||
|
Total
marketable securities
|
$
|
2,750
|
$
|
—
|
$
|
—
|
$
|
2,750
|
|||||
|
5.
|
RELATED
PARTY NOTES RECEIVABLE.
|
|
6.
|
PROPERTY
AND EQUIPMENT.
|
|
December 31,
|
|||||||
|
2006
|
2005
|
||||||
|
Land
|
$
|
4,350
|
$
|
515
|
|||
|
Water
rights - capital lease
|
1,607
|
—
|
|||||
|
Facilities
|
43,701
|
4,235
|
|||||
|
Equipment
and vehicles
|
124,059
|
374
|
|||||
|
Office
furniture, fixtures and equipment
|
1,338
|
378
|
|||||
|
|
175,055
|
5,502
|
|||||
|
Accumulated
depreciation
|
(2,511
|
)
|
(211
|
)
|
|||
|
172,544
|
5,291
|
||||||
|
Construction
in progress
|
23,612
|
17,917
|
|||||
|
$
|
196,156
|
$
|
23,208
|
||||
|
7.
|
GOODWILL
AND OTHER INTANGIBLE ASSETS.
|
|
December 31,
2006
|
December 31,
2005
|
||||||||||||||||||
|
Useful
Life
(Years)
|
Gross
|
Accumulated
Amortization/
Impairment
|
Net
Book
Value
|
Gross
|
Accumlated
Amortization/
Impairment
|
Net
Book
Value
|
|||||||||||||
|
Non-Amortizing:
|
|||||||||||||||||||
|
Goodwill
recognized in business combinations
|
$
|
85,307
|
$
|
—
|
$
|
85,307
|
$
|
2,566
|
$
|
—
|
$
|
2,566
|
|||||||
|
Trademarks,
brand names
|
2,678
|
—
|
2,678
|
2,678
|
—
|
2,678
|
|||||||||||||
|
Amortizing:
|
|||||||||||||||||||
|
Customer
relationships
|
10
|
4,741
|
840
|
3,901
|
4,741
|
366
|
4,375
|
||||||||||||
|
Non-compete
covenants
|
2-3
|
1,095
|
444
|
651
|
695
|
179
|
516
|
||||||||||||
|
Customer
backlogs
|
<1
|
4,036
|
1,111
|
2,925
|
136
|
136
|
—
|
||||||||||||
|
Total
goodwill and intangible assets
|
$
|
97,857
|
$
|
2,395
|
$
|
95,462
|
$
|
10,816
|
$
|
681
|
$
|
10,135
|
|||||||
|
Year
Ended
December
31,
|
Amount
|
|||
|
2007
|
$
|
3,831
|
||
|
2008
|
694
|
|||
|
2009
|
474
|
|||
|
2010
|
474
|
|||
|
2011
|
474
|
|||
|
Total
|
$
|
5,947
|
|
8.
|
ACCRUED
LIABILITIES
|
|
2006
|
2005
|
||||||
|
Fire
damage restoration in progress
|
$
|
131
|
$
|
3,158
|
|||
|
Insurance
policy premium financing
|
—
|
209
|
|||||
|
Accrued
interest payable
|
465
|
—
|
|||||
|
Derivative
instruments
|
97
|
—
|
|||||
|
Other
taxes payable
|
579
|
—
|
|||||
|
Other
accrued liabilities
|
3,526
|
56
|
|||||
|
Total
accrued liabilities
|
$
|
4,798
|
$
|
3,423
|
|||
|
9.
|
LINES
OF CREDIT.
|
|
10.
|
DEBT
|
|
2006
|
2005
|
||||||
|
Secured
floating rate notes, due August 2011
|
|||||||
|
Swap
Note - is a term loan, with a floating interest rate, established
on a
quarterly basis, equal to the 90-day LIBOR, plus 3.00%. The loan
matures
in five years, but has required principal payments due based on a
ten year
amortization schedule. Quarterly payments of principal are approximately
$675, including interest. Front Range has entered into a swap contract
with the lender to provide a fixed rate of 8.16% and equal to the
outstanding balance of the note.
|
$
|
17,658
|
$
|
—
|
|||
|
Variable
Rate Note - is a term loan that carries an interest rate that will
float
at a rate equal to the 90-day LIBOR, plus 2.75-3.50%, depending on
Front
Range’s debt-to-net worth ratio. The variable loan matures in five years
and includes required quarterly payments of approximately $654 which
are
applied in a cascading order, as follows: Long Term Revolving Note
interest, Variable Rate Note interest, Variable Rate Note principal,
Long
Term Revolving Note principal.
|
12,607
|
—
|
|||||
|
Long
Term Revolving Note - is a revolving loan in the amount of $5,000
and
carries an interest rate that will float at a rate equal to the 30-day
LIBOR, plus 2.75-3.50%, depending on Front Range’s debt-to-net worth
ratio. Repayment terms are included above in the description of the
Variable Rate Note.
|
1,617
|
—
|
|||||
|
Water
rights capital lease obligations
|
1,213
|
—
|
|||||
|
33,095
|
—
|
||||||
|
Less
short-term portion
|
(4,125
|
)
|
—
|
||||
|
Long-term
debt
|
$
|
28,970
|
$
|
—
|
|||
|
Cash
and cash equivalents
|
$
|
5,920
|
||
|
Investments
in marketable securities
|
11,119
|
|||
|
Accounts
receivable
|
1,676
|
|||
|
Inventories
|
2,511
|
|||
|
Other
assets
|
121
|
|||
|
Property
and equipment
|
93,404
|
|||
|
Intangible
assets
|
3,292
|
|||
|
Total
collateralized assets
|
$
|
118,043
|
|
Year
Ended December 31,
|
Amount
|
|||
|
2007
|
$
|
4,125
|
||
|
2008
|
3,009
|
|||
|
2009
|
3,264
|
|||
|
2010
|
3,536
|
|||
|
2011
|
18,476
|
|||
|
Thereafter
|
685
|
|||
|
Total
|
$
|
33,095
|
||
|
11.
|
CUMULATIVE
EFFECT ADJUSTMENT
|
|
Period
in Which Misstatement Originated(1)
|
|||||||
|
Year
Ended
December
31, 2005
|
Adjustment
Recorded
as of January 1, 2006
|
||||||
|
Goodwill(2)
|
$
|
2,134
|
$
|
2,134
|
|||
|
Deferred
tax liability(2)
|
$
|
(1,091
|
)
|
$ |
(1,091
|
)
|
|
|
Impact
on net income (loss)(3)
|
$
|
1,043
|
$ |
—
|
|||
|
Retained
earnings(4)
|
$
|
1,043
|
|||||
| (1) |
The
Company previously quantified these errors under the roll-over method
and
concluded that they were immaterial individually and in the
aggregate.
|
| (2) |
In
allocating the purchase price with respect to the Kinergy acquisition,
no
adjustment was made to record a deferred tax liability for the difference
between the recorded value of the assets acquired and their associated
tax
basis. Such an adjustment would have increased goodwill by the amount
of
the deferred tax liability recorded. In addition, goodwill would
have been
reduced by the amount of any valuation allowance attributable to
any
pre-acquisition deferred tax asset of the Company that could more
likely
than not have been utilized against the recorded deferred tax liability.
|
| (3) |
Represents
the net overstatement of net loss for the indicated period resulting
from
the misstatements
|
| (4) |
Represents
the increase in retained earnings recorded as of January 1, 2006
to record
the initial application of SAB No.
108.
|
|
12.
|
INCOME
TAXES.
|
|
2006
|
2005
|
2004
|
||||||||
|
Statutory
rate
|
(35.0)%
|
|
(35.0)%
|
|
(35.0)%
|
|
||||
|
State
income taxes, net of federal benefit
|
—
|
(5.7)
|
|
— | ||||||
|
Non-deductible
items
|
15.6
|
10.7
|
(0.1)
|
|
||||||
|
Prior
year purchase accounting adjustment
|
1,599.9
|
—
|
— | |||||||
|
Valuation
allowance relating to equity items
|
369.8
|
(4.7)
|
|
35.1
|
||||||
|
Change
in valuation allowance
|
(2,091.8)
|
|
34.7
|
— | ||||||
|
Other
|
141.5
|
|
—
|
— | ||||||
|
Effective
rate
|
0.0%
|
|
0.0%
|
|
0.0%
|
|
||||
|
2006
|
2005
|
||||||
|
Deferred
tax assets:
|
|||||||
|
Other
accrued liabilities
|
$
|
140
|
$
|
140
|
|||
|
Stock
option compensation
|
569
|
505
|
|||||
|
Net
operating loss carryforward(1)
|
6,623
|
5,715
|
|||||
|
Other
|
8
|
—
|
|||||
|
Total
deferred tax assets
|
7,340
|
6,360
|
|||||
|
Deferred
tax liabilities:
|
|||||||
|
Fixed
assets
|
(1,228
|
)
|
—
|
||||
|
Investment
in partnerships
|
(586
|
)
|
—
|
||||
|
Unrealized
gain on available-for-sale securities
|
(142
|
)
|
—
|
||||
|
Unrealized
gain on derivatives
|
(80
|
)
|
—
|
||||
|
State
tax expense
|
(6
|
)
|
—
|
||||
|
Intangibles
|
(2,997
|
)
|
—
|
||||
|
Total
deferred tax liabilities
|
(5,039
|
)
|
6,360
|
||||
|
Less
valuation allowance
|
(3,392
|
)
|
(6,360
|
)
|
|||
|
Net
deferred tax liabilities
|
$
|
(1,091
|
)
|
$
|
—
|
||
|
Classified
in balance sheet as:
|
|||||||
|
Deferred
income tax benefit (current assets)
|
$
|
—
|
$
|
—
|
|||
|
Deferred
income taxes (long-term liability)
|
(1,091
|
)
|
—
|
||||
|
$
|
(1,091
|
)
|
$
|
—
|
|||
| (1) |
The
deferred tax asset for the Company’s net operating loss carryforwards at
December 31, 2006 does not include $4,372,000 which relates to the
tax benefits associated with warrants and non-statutory options exercised
by employees, members of the board and others under the various incentive
plans. These tax benefits will be recognized in stockholders’ equity
rather than in operations in accordance with SFAS No. 109 but not
until
the period that these amounts decrease taxes
payable.
|
|
13.
|
RELATED
PARTY NOTES PAYABLE.
|
|
14.
|
STOCKHOLDERS’
EQUITY.
|
|
Year
Ended December 31,
|
|||||||||||||||||||
|
2006
|
2005
|
2004
|
|||||||||||||||||
|
Number
of
Shares
|
Weighted-Average
Exercise Price
|
Number
of
Shares
|
Weighted-Average
Exercise Price
|
Number
of
Shares
|
Weighted-
Average Exercise Price
|
||||||||||||||
|
Outstanding
at beginning of year
|
927
|
$
|
7.53
|
25
|
$
|
0.01
|
—
|
—
|
|||||||||||
|
Granted
|
—
|
—
|
822
|
7.78
|
25
|
0.01
|
|||||||||||||
|
Acquired
in Share Exchange Transaction
|
—
|
—
|
378
|
5.98
|
—
|
—
|
|||||||||||||
|
Exercised
|
(196
|
)
|
7.06
|
(270
|
)
|
6.10
|
—
|
—
|
|||||||||||
|
Terminated
|
(263
|
)
|
8.04
|
(28
|
)
|
0.01
|
—
|
—
|
|||||||||||
|
Outstanding
at end of year
|
468
|
7.42
|
927
|
7.53
|
25
|
0.01
|
|||||||||||||
|
Options
exercisable at end of year
|
297
|
$
|
7.36
|
262
|
$
|
7.57
|
25
|
$
|
0.01
|
||||||||||
|
Options
Outstanding
|
Options
Exercisable
|
|||||||||||||||
|
Range
of
Exercise
Prices
|
Number
Outstanding
|
Weighted
Average Remaining
Contractual
Life
|
Weighted-Average
Exercise
Price
|
Number
Exercisable
|
Weighted
Average
Exercise
Price
|
|||||||||||
|
$ 4.88
|
10
|
2.67
|
4.88
|
10
|
4.88
|
|||||||||||
|
5.00
|
10
|
2.81
|
5.00
|
10
|
5.00
|
|||||||||||
|
6.25
|
43
|
1.42
|
6.25
|
43
|
6.25
|
|||||||||||
|
6.63
|
120
|
8.67
|
6.63
|
60
|
6.63
|
|||||||||||
|
8.03
|
185
|
.79
|
8.03
|
74
|
8.03
|
|||||||||||
|
8.25
|
85
|
8.57
|
8.25
|
85
|
8.25
|
|||||||||||
|
8.30
|
15
|
8.58
|
8.30
|
15
|
8.30
|
|||||||||||
|
468
|
297
|
|||||||||||||||
|
Options
Granted in
Year
Ended December 31,
|
Risk-Free
Interest
Rate
|
Expected
Life
at
Issuance
|
Expected
Volatility
|
Expected
Dividends
|
||||
|
2006
|
None
|
None
|
None
|
None
|
||||
|
2005
|
3.9
to 4.5%
|
5.5
to 10 years
|
53.6%
|
None
|
||||
|
2004
|
3.9
to 4.5%
|
5.5
to 10 years
|
53.6%
|
None
|
|
Year
Ended December 31,
|
|||||||
|
2005
|
2004
|
||||||
|
Loss
from operations, as reported
|
$
|
(9,483
|
)
|
$
|
(2,270
|
)
|
|
|
Stock-based
employee compensation expense included in reported net
loss
|
964
|
—
|
|||||
|
Stock-based
compensation awards, fair value method
|
(1,909
|
)
|
—
|
||||
|
Loss
from operations, pro forma
|
$
|
(10,428
|
)
|
$
|
(2,270
|
)
|
|
|
Net
loss, as reported
|
(9,923
|
)
|
(2,802
|
)
|
|||
|
Stock-based
employee compensation expense included in reported net
loss
|
964
|
—
|
|||||
|
Stock-based
compensation awards, fair value method
|
(1,909
|
)
|
—
|
||||
|
Net
loss, pro forma
|
$
|
(10,868
|
)
|
$
|
(2,802
|
)
|
|
|
Net
loss per share, basic and diluted
|
$
|
(0.43
|
)
|
$
|
(0.23
|
)
|
|
|
Weighted-average
shares outstanding, basic and diluted
|
25,066
|
12,397
|
|||||
|
Year
Ended December 31,
|
||||||||||
|
2006
|
2005
|
2004
|
||||||||
|
Employees
- included in general and administrative
|
$
|
4,466
|
$
|
963
|
$
|
—
|
||||
|
Non-employees
- included in general and administrative
|
1,782
|
1,099
|
1,208
|
|||||||
|
Total
stock-based compensation expense
|
$
|
6,248
|
$
|
2,062
|
$
|
1,208
|
||||
|
Number
of
Shares
|
Price
per
Share
|
Weighted
Average
Exercise
Price
|
||||||||
|
Balance
at December 31, 2003
|
42
|
$
|
1.50
|
$
|
1.50
|
|||||
|
Warrants
granted
|
1,003
|
$
|
0.0001
- $5.00
|
0.27
|
||||||
|
Warrants
exercised
|
(920
|
)
|
$
|
0.0001
|
0.0001
|
|||||
|
Balance
at December 31, 2004
|
125
|
$
|
1.50
- $5.00
|
$
|
2.24
|
|||||
|
Warrants
granted
|
3,058
|
$
|
0.0001
- $5.00
|
3.21
|
||||||
|
Warrants
exercised
|
(278
|
)
|
$
|
0.0001
- $5.00
|
2.01
|
|||||
|
Balance
at December 31, 2005
|
2,905
|
$
|
0.0001
- $5.00
|
$
|
3.26
|
|||||
|
Warrants
granted
|
3,442
|
$
|
14.41
- $31.55
|
27.66
|
||||||
|
Warrants
exercised
|
(2,747
|
)
|
$
|
0.0001
- $5.00
|
3.28
|
|||||
|
Balance
at December 31, 2006
|
3,600
|
$
|
0.0001
- $31.55
|
$
|
26.57
|
|||||
|
Warrants
Outstanding
|
Warrants
Exercisable
|
|||||||||
|
Range
of
Exercise
Prices
|
Number
Outstanding
|
Weighted-Average
Remaining
Contractual
Life
|
Weighted-Average
Exercise
Price
|
Number
Exercisable
|
Weighted-
Average
Exercise
Price
|
|||||
|
$0.0001
|
29
|
2.23
|
$ 0.0001
|
—
|
$ 0.0001
|
|||||
|
3.00
|
86
|
|
0.23
|
3.00
|
86
|
3.00
|
||||
|
5.00
|
43
|
0.23
|
5.00
|
43
|
5.00
|
|||||
|
14.41
|
694
|
0.79
|
14.41
|
694
|
14.41
|
|||||
|
31.55
|
2,748
|
0.16
|
31.55
|
2,748
|
31.55
|
|||||
|
3,600
|
|
3,571
|
||||||||
|
COMMITMENTS
AND CONTINGENCIES.
|
|
Year
Ended
December
31,
|
Amount
|
|||
|
2007
|
$
|
267
|
||
|
2008
|
203
|
|||
|
2009
|
172
|
|||
|
2010
|
172
|
|||
|
2011
|
110
|
|||
|
Total
|
$
|
924
|
||
|
Fixed-Price
Contracts
|
Indexed-Price
Contracts
(Volume)
|
||||||
|
Ethanol
(gallons)
|
$
|
41,443
|
3,665
|
||||
|
Corn
(bushels)
|
38,697
|
9,138
|
|||||
|
Natural
gas (decatherms)
|
1,805
|
—
|
|||||
|
Denaturant
(gallons)
|
—
|
567
|
|||||
|
Total
|
$
|
81,945
|
|||||
|
Fixed-Price
Contracts
|
Indexed-Price
Contracts
(Volume)
|
||||||
|
Ethanol
(gallons)
|
$
|
82,931
|
36,238
|
||||
|
Corn
(bushels)
|
4,829
|
—
|
|||||
|
Total
|
$
|
87,760
|
|||||
|
16.
|
DERIVATIVES.
|
|
Commodity
Derivatives
|
Interest
Rate Derivatives
|
||||||
|
Gain/(Loss)*
|
Gain/(Loss)*
|
||||||
|
Beginning
balance, January 1, 2006
|
$
|
—
|
$
|
—
|
|||
|
Net
changes
|
1,307
|
(272
|
)
|
||||
|
Less:
Amount reclassified to revenue
|
1,281
|
—
|
|||||
|
Less:
Amount reclassified to cost of goods sold
|
(435
|
)
|
—
|
||||
|
Less:
Amount reclassified to other income (expense)
|
—
|
(7
|
)
|
||||
|
Ending
balance, December 31, 2006
|
$
|
461
|
$
|
(265
|
)
|
||
|
17.
|
RELATED
PARTY TRANSACTIONS.
|
|
18.
|
QUARTERLY
FINANCIAL DATA.
|
|
First
Quarter
|
Second
Quarter
|
Third
Quarter
|
Fourth
Quarter
|
||||||||||
| Results of operations: | |||||||||||||
| 2006: | |||||||||||||
|
Net
sales
|
$
|
38,239
|
$
|
46,461
|
$
|
61,102
|
$
|
80,554
|
|||||
|
Gross
profit
|
2,325
|
3,308
|
7,448
|
11,748
|
|||||||||
|
Operating
income (loss)
|
(659
|
)
|
(1,450
|
)
|
1,900
|
397
|
|||||||
|
Net
income (loss)
|
(612
|
)
|
(182
|
)
|
3,755
|
(3,103
|
)
|
||||||
|
Preferred
stock dividend
|
—
|
(898
|
)
|
(1,050
|
)
|
(1,050
|
)
|
||||||
|
Deemed
dividend on preferred stock
|
—
|
(84,000
|
)
|
—
|
—
|
||||||||
|
Income
(loss) available to common stockholders
|
(612
|
)
|
(85,080
|
)
|
2,705
|
(4,153
|
)
|
||||||
|
2005:
|
|||||||||||||
|
Net
sales
|
$
|
2,302
|
$
|
22,814
|
$
|
26,414
|
$
|
36,069
|
|||||
|
Gross
profit
|
48
|
151
|
1,636
|
1,320
|
|||||||||
|
Operating
loss
|
(1,548
|
)
|
(2,242
|
)
|
(978
|
)
|
(4,715
|
)
|
|||||
|
Net
loss
|
(1,657
|
)
|
(2,226
|
)
|
(923
|
)
|
(5,117
|
)
|
|||||
|
Loss
per common share:
|
|||||||||||||
|
2006:
|
|||||||||||||
|
Basic
and diluted loss
|
$
|
(.02
|
)
|
$
|
(2.56
|
)
|
$
|
.07
|
$
|
(.11
|
)
|
||
|
2005:
|
|||||||||||||
|
Basic
and diluted loss
|
$
|
(.10
|
)
|
$
|
(.08
|
)
|
$
|
(.03
|
)
|
$
|
(.21
|
)
|
|
|
19.
|
SUBSEQUENT
EVENTS.
|
|
Exhibit
Number
|
Description
|
|
|
2.1
|
Agreement
and Plan of Merger dated March 23, 2005 between the Registrant and
Accessity Corp. (1)
|
|
|
2.2
|
Share
Exchange Agreement dated as of May 14, 2004 by and among Accessity
Corp.,
Pacific Ethanol, Inc., Kinergy Marketing, LLC, ReEnergy, LLC and
the other
parties named therein (1)
|
|
|
2.3
|
Amendment
No. 1 to Share Exchange Agreement dated as of July 29, 2004 by and
among
Accessity Corp., Pacific Ethanol, Inc., Kinergy Marketing, LLC, ReEnergy,
LLC and the other parties named therein (1)
|
|
|
2.4
|
Amendment
No. 2 to Share Exchange Agreement dated as of October 1, 2004 by
and among
Accessity Corp., Pacific Ethanol, Inc., Kinergy Marketing, LLC, ReEnergy,
LLC and the other parties named therein (1)
|
|
|
2.5
|
Amendment
No. 3 to Share Exchange Agreement dated as of January 7, 2005 by
and among
Accessity Corp., Pacific Ethanol, Inc., Kinergy Marketing, LLC, ReEnergy,
LLC and the other parties named therein (1)
|
|
|
2.6
|
Amendment
No. 4 to Share Exchange Agreement dated as of February 16, 2005 by
and
among Accessity Corp., Pacific Ethanol, Inc., Kinergy Marketing,
LLC,
ReEnergy, LLC and the other parties named therein (1)
|
|
|
2.7
|
Amendment
No. 5 to Share Exchange Agreement dated as of March 3, 2005 by and
among
Accessity Corp., Pacific Ethanol, Inc., Kinergy Marketing, LLC, ReEnergy,
LLC and the other parties named therein (1)
|
|
|
3.1
|
Certificate
of Incorporation of the Registrant (1)
|
|
|
3.2
|
Certificate
of Designations, Powers, Preferences and Rights of the Series A Cumulative
Redeemable Convertible Preferred Stock (14)
|
|
|
3.3
|
Bylaws
of the Registrant (1)
|
|
|
10.1
|
Form
of Registration Rights Agreement of various dates between Pacific
Ethanol,
Inc., a California corporation and the investors who are parties
thereto
(7)
|
|
|
10.2
|
Form
of Placement Warrant dated effective of various dates issued by Pacific
Ethanol, Inc., a California corporation, to certain placement agents
(7)
|
|
|
10.3
|
Form
of Registration Rights Agreement dated effective May 14, 2004 between
Pacific Ethanol, Inc., a California corporation and the investors
who are
parties thereto (6)
|
|
|
10.4
|
Form
of Placement Warrant dated effective May 14, 2004 issued by Pacific
Ethanol, Inc., a California corporation, to certain placement agents
(7)
|
|
|
10.5
|
Form
of Registration Rights Agreement of various dates between Pacific
Ethanol,
Inc., a California corporation and the investors who are parties
thereto
(6)
|
|
|
10.6
|
Form
of Warrant of various dates issued to subscribers to a private placement
of securities of Pacific Ethanol, Inc., a California corporation
(7)
|
|
|
10.7
|
Form
of Registration Rights Agreement dated effective March 23, 2005 between
Pacific Ethanol, Inc., a California corporation and the investors
who are
parties thereto (1)
|
|
|
10.8
|
Form
of Warrant dated March 23, 2005 issued by the Registrant to subscribers
to
a private placement of securities by Pacific Ethanol, Inc., a California
corporation (1)
|
|
|
10.9
|
Form
of Placement Warrant dated March 23, 2005 issued by the Registrant
to
certain placement agents (1)
|
|
|
10.10
|
Confidentiality,
Non-Competition, Non-Solicitation and Consulting Agreement dated
March 23,
2005 between the Registrant and Barry Siegel
(1)
|
|
Exhibit
Number
|
Description
|
|
|
10.11
|
Confidentiality,
Non-Competition, Non-Solicitation and Consulting Agreement dated
March 23,
2005 between the Registrant and Philip B. Kart (1)
|
|
|
10.12
|
Form
of Confidentiality, Non-Competition and Non-Solicitation Agreement
dated
March 23, 2005 between the Registrant and each of Neil M. Koehler,
Tom
Koehler, William L. Jones, Andrea Jones and Ryan W. Turner
(1)
|
|
|
10.13
|
Confidentiality,
Non-Competition and Non-Solicitation Agreement dated March 23, 2005
between the Registrant and Neil M. Koehler (1)
|
|
|
10.14
|
Form
of Indemnification Agreement between the Registrant and each of its
Executive Officers and Directors (#) (14)
|
|
|
10.15
|
Executive
Employment Agreement dated March 23, 2005 between the Registrant
and Neil
M. Koehler (#)(1)
|
|
|
10.16
|
Executive
Employment Agreement dated March 23, 2005 between the Registrant
and Ryan
W. Turner (#)(1)
|
|
|
10.17
|
Stock
Purchase Agreement and Assignment and Assumption Agreement dated
March 23,
2005 between the Registrant and Barry Siegel (1)
|
|
|
10.18
|
Letter
Agreement dated March 23, 2005 between the Registrant and Neil M.
Koehler
(1)
|
|
|
10.19
|
Ethanol
Purchase and Marketing Agreement dated March 4, 2005 between Kinergy
Marketing, LLC, Phoenix Bio-Industries, LLC, Pacific Ethanol, Inc.
and
Western Milling, LLC (2)
|
|
|
10.20
|
Pacific
Ethanol Inc. 2004 Stock Option Plan (3)
|
|
|
10.21
|
First
Amendment to Pacific Ethanol, Inc. 2004 Stock Option Plan
(13)
|
|
|
10.22
|
Amended
1995 Stock Option Plan (4)
|
|
|
10.23
|
Warrant
dated March 23, 2005 issued by the Registrant to Liviakis Financial
Communications, Inc. (1)
|
|
|
10.24
|
Executive
Employment Agreement dated August 10, 2005 between the Registrant
and
William G. Langley (#)(5)
|
|
|
10.25
|
Ethanol
Marketing Agreement dated as of August 31, 2005 by and between Kinergy
Marketing, LLC and Front Range Energy, LLC (8)
|
|
|
10.26
|
Master
Revolving Note dated September 24, 2004 of Kinergy Marketing, LLC
in favor
of Comerica Bank (9)
|
|
|
10.27
|
Loan
Revision/Extension Agreement dated October 4, 2005 and effective
as of
June 20, 2005 between Kinergy Marketing, LLC and Comerica Bank
(9)
|
|
|
10.28
|
Letter
Agreement dated as of October 4, 2005 between Kinergy Marketing,
LLC and
Comerica Bank (9)
|
|
|
10.29
|
Guaranty
dated October 4, 2005 by Pacific Ethanol, Inc. in favor of Comerica
Bank
(9)
|
|
|
10.30
|
Security
Agreement dated as of September 24, 2004 executed by Kinergy Marketing,
LLC in favor of Comerica Bank (12)
|
|
|
10.31
|
Amended
and Restated Phase 1 Design-Build Agreement dated November 2, 2005
by and
between Pacific Ethanol Madera LLC and W.M. Lyles Co.
(10)
|
|
|
10.32
|
Phase
2 Design-Build Agreement dated November 2, 2005 by and between Pacific
Ethanol Madera LLC and W.M. Lyles Co. (10)
|
|
|
10.33
|
Letter
Agreement dated November 2, 2005 by and between Pacific Ethanol
California, Inc. and W.M. Lyles Co.
(10)
|
|
Exhibit
Number
|
Description
|
|
|
10.34
|
Continuing
Guaranty dated as of November 3, 2005 by William L. Jones in favor
of
W.M. Lyles Co. (10)
|
|
|
10.35
|
Continuing
Guaranty dated as of November 3, 2005 by Neil M. Koehler in favor
of
W.M. Lyles Co. (10)
|
|
|
10.36
|
Description
of Non-Employee Director Compensation (11)
|
|
|
10.37
|
Purchase
Agreement dated November 14, 2005 between Pacific Ethanol, Inc. and
Cascade Investment, L.L.C. (11)
|
|
|
10.38
|
Deposit
Agreement dated April 13, 2006 by and between Pacific Ethanol, Inc.
and
Comerica Bank (14)
|
|
|
10.39
|
Registration
Rights and Stockholders Agreement dated as of April 13, 2006 by and
between Pacific Ethanol, Inc. and Cascade Investment, L.L.C.
(14)
|
|
|
10.40
|
Amendment
No. 1 to Ethanol Purchase and Marketing Agreement dated effective
as of
March 4, 2005 between Kinergy Marketing, LLC, Phoenix Bio-Industries,
LLC, Pacific Ethanol, Inc. and Western Milling, LLC
(14)
|
|
|
10.41
|
Construction
and Term Loan Agreement dated April 10, 2006 by and among Pacific
Ethanol
Madera LLC, Comerica Bank and Hudson United Capital, a division of
TD
Banknorth, N.A. (14)
|
|
|
10.42
|
Construction
Loan Note dated April 13, 2006 by Pacific Ethanol Madera LLC in favor
of
Comerica Bank (14)
|
|
|
10.43
|
Construction
Loan Note dated April 13, 2006 by Pacific Ethanol Madera LLC in favor
of
Hudson United Capital, a division of TD Banknorth, N.A.
(14)
|
|
|
10.44
|
Assignment
and Security Agreement dated April 13, 2006 by and between Pacific
Ethanol
Madera LLC and Hudson United Capital, a division of TD Banknorth,
N.A.
(14)
|
|
|
10.45
|
Member
Interest Pledge Agreement dated April 13, 2006 by Pacific Ethanol
Madera
LLC in favor of Hudson United Capital, a division of TD Banknorth,
N.A.
(14)
|
|
|
10.46
|
Disbursement
Agreement dated April 13, 2006 by and among Pacific Ethanol Madera
LLC,
Hudson United Capital, a division of TD Banknorth, N.A., Comerica
Bank and
Wealth Management Group of TD Banknorth, N.A. (14)
|
|
|
10.47
|
Amended
and Restated Term Loan Agreement effective as of April 13, 2006 by
and
between Lyles Diversified, Inc. and Pacific Ethanol Madera LLC
(14)
|
|
|
10.48
|
Letter
Agreement dated as of April 13, 2006 by and among Pacific Ethanol
California, Inc., Lyles Diversified, Inc. and Pacific Ethanol Madera
LLC
(14)
|
|
|
10.49
|
Deed
of Trust, Assignment of Leases and Rents, Security Agreement and
Fixture
Filing dated April 13, 2006 by Pacific Ethanol Madera LLC in favor
of
Hudson United Capital, a division of TD Banknorth, N.A.
(15)
|
|
|
10.50
|
Deed
of Trust (Non-Construction) Security Agreement and Fixture Filing
with
Assignment of Rents dated April 13, 2006 by Pacific Ethanol Madera
LLC in
favor of Lyles Diversified, Inc. (15)
|
|
|
10.51
|
Securities
Purchase Agreement dated as of May 25, 2006 by and among Pacific
Ethanol,
Inc. and the investors listed on the Schedule of Investors attached
thereto as Exhibit A (16)
|
|
|
10.52
|
Form
of Warrant dated May 31, 2006 (16)
|
|
|
10.53
|
Executive
Employment Agreement dated as of June 26, 2006 by and between Pacific
Ethanol, Inc. and John T. Miller (17)
|
|
|
10.54
|
Executive
Employment Agreement dated as of June 26, 2006 by and between Pacific
Ethanol, Inc. and Christopher W. Wright
(17)
|
|
Exhibit
Number
|
Description
|
|
|
10.55
|
Amended
and Restated Ethanol Purchase and Sale Agreement dated as of August
9,
2006 by and between Kinergy Marketing, LLC and Front Range Energy,
LLC
(18)
|
|
|
10.56
|
Construction
Agreement for the Boardman Project between Pacific Ethanol Columbia,
LLC
and Parsons RCIE Inc. dated as of August 28, 2006 (19)
|
|
|
10.57
|
Engineering,
Procurement and Technology License Agreement dated September 6, 2006
by
and between Delta-T Corporation and PEI Columbia, LLC
(*)(21)
|
|
|
10.58
|
Engineering,
Procurement and Technology License Agreement (Plant No. 3) dated
September
6, 2006 by and between Delta-T Corporation and Pacific Ethanol, Inc.
(*)(21)
|
|
|
10.59
|
Engineering,
Procurement and Technology License Agreement (Plant No. 4) dated
September
6, 2006 by and between Delta-T Corporation and Pacific Ethanol, Inc.
(*)(21)
|
|
|
10.60
|
Engineering,
Procurement and Technology License Agreement (Plant No. 5) dated
September
6, 2006 by and between Delta-T Corporation and Pacific Ethanol, Inc.
(*)(21)
|
|
|
10.61
|
Pacific
Ethanol, Inc. 2006 Stock Incentive Plan (#)(20)
|
|
|
10.62
|
Form
of Employee Restricted Stock Agreement (#)(22)
|
|
|
10.63
|
Form
of Non-Employee Director Restricted Stock Agreement
(#)(22)
|
|
|
10.64
|
Amendment
No. 1 to Construction and Term Loan Agreement and Agreement as to
Future
Financing Transactions dated September 29, 2006 by and among Pacific
Ethanol Madera LLC, TD Banknorth, N.A., Comerica Bank and Pacific
Ethanol,
Inc. (23)
|
|
|
10.65
|
Membership
Interest Purchase Agreement dated as of October 17, 2006 by and among
Eagle Energy, LLC, Pacific Ethanol California, Inc. and Pacific Ethanol,
Inc. (24)
|
|
|
10.66
|
Warrant
to Purchase Common Stock dated October 17, 2006 issued to Eagle Energy,
LLC by Pacific Ethanol, Inc. (24)
|
|
|
10.67
|
Registration
Rights Agreement dated as of October 17, 2006 by and between Pacific
Ethanol, Inc. and Eagle Energy, LLC (24)
|
|
|
10.68
|
Second
Amended and Restated Operating Agreement of Front Range Energy, LLC
among
the members identified therein (as amended by Amendment No. 1 described
below) (24)
|
|
|
10.69
|
Amendment
No. 1, dated as of October 17, 2006, of the Second Amended and Restated
Operating Agreement of Front Range Energy, LLC to Add a Substitute
Member
and for Certain Other Purposes (24)
|
|
|
10.70
|
Form
of Non-Competition Agreement dated as of October 17, 2006 by and
among
Pacific Ethanol, Inc., Front Range Energy, LLC and each of the members
of
Eagle Energy, LLC (24)
|
|
|
10.71
|
Amendment
to Amended and Restated Ethanol Purchase and Sale Agreement dated
October
17, 2006 between Kinergy Marketing, LLC and Front Range Energy, LLC
(24)
|
|
|
10.72
|
Separation
and Consulting Agreement dated December 14, 2006 between Pacific
Ethanol,
Inc. and William G. Langley (25)
|
|
|
21.1
|
Subsidiaries
of the Registrant
|
|
|
23.1
|
Consent
of Independent Registered Public Accounting Firm
|
|
|
31.1
|
Certification
Required by Rule 13a-14(a) of the Securities Exchange Act of 1934,
as
amended, as Adopted Pursuant to Section 302 of the Sarbanes-Oxley
Act of
2002
|
|
Exhibit
Number
|
Description
|
|
|
31.2
|
Certification
Required by Rule 13a-14(a) of the Securities Exchange Act of 1934,
as
amended, as Adopted Pursuant to Section 302 of the Sarbanes-Oxley
Act of
2002
|
|
|
32.
|
Certification
of Chief Executive Officer and Chief Financial Officer Pursuant to
18
U.S.C. Section 1350, as Adopted Pursuant to Section 906 of the
Sarbanes-Oxley Act of 2002
|
|
(#)
|
Management
contract or compensatory plan, contract or arrangement required
to be
filed as an exhibit.
|
|
(*)
|
Portions
of this exhibit have been omitted pursuant to a request for confidential
treatment filed with the Securities and Exchange
Commission.
|
|
(1)
|
Filed
as an exhibit to the Registrant’s current report on Form 8-K for
March 23, 2005 filed with the Securities and Exchange Commission
on March
29, 2005 and incorporated herein by reference.
|
|
(2)
|
Filed
as an exhibit to the Registrant’s quarterly report on Form 10-QSB for
March 31, 2005 (File No. 0-21467) filed with the Securities and
Exchange
Commission on May 23, 2005 and incorporated herein by
reference.
|
|
(3)
|
Filed
as an exhibit to the Registrant’s Registration Statement on Form S-8 (Reg.
No. 333-123538) filed with the Securities and Exchange Commission
on March
24, 2005 and incorporated herein by reference.
|
|
(4)
|
Filed
as an exhibit to the Registrant’s annual report Form 10-KSB for
December 31, 2002 (File No. 0-21467) filed with the Securities
and
Exchange Commission on March 31, 2003 and incorporated herein by
reference.
|
|
(5)
|
Filed
as an exhibit to the Registrant’s current report on Form 8-K for
August 10, 2005 filed with the Securities and Exchange Commission
on
August 16, 2005 and incorporated herein by reference.
|
|
(6)
|
The
Form of the Registration Rights Agreement was filed as Exhibit
4.4 to the
Registrant’s Registration Statement on Form S-1 (Reg. No. 333-127714)
filed with the Securities and Exchange Commission on August 19,
2005 and
incorporated herein by reference.
|
|
(7)
|
Filed
as an exhibit to the Registrant’s Registration Statement on Form S-1 (Reg.
No. 333-127714) filed with the Securities and Exchange Commission on
August 19, 2005 and incorporated herein by reference.
|
|
(8)
|
Filed
as an exhibit to the Registrant’s current report on Form 8-K for
August 31, 2005 filed with the Securities and Exchange Commission
on
September 7, 2005 and incorporated herein by reference.
|
|
(9)
|
Filed
as an exhibit to the Registrant’s current report on Form 8-K for
November 1, 2005 filed with the Securities and Exchange Commission
on
November 7, 2005 and incorporated herein by reference.
|
|
(10)
|
Filed
as an exhibit to the Registrant’s current report on Form 8-K for
November 2, 2005 filed with the Securities and Exchange Commission
on
November 8, 2005 and incorporated herein by reference.
|
|
(11)
|
Filed
as an exhibit to the Registrant’s current report on Form 8-K for
November 10, 2005 filed with the Securities and Exchange Commission
on
November 15, 2005 and incorporated herein by reference.
|
|
(12)
|
Filed
as an exhibit to the Registrant’s Amendment No. 2 to Registration
Statement on Form S-1 (Reg. No. 333-127714) filed with the Securities
and
Exchange Commission on November 22, 2005 and incorporated herein
by
reference.
|
|
(13)
|
Filed
as an exhibit to the Registrant’s current report on Form 8-K for
January 26, 2006 filed with the Securities and Exchange Commission
on
February 1, 2006 and incorporated herein by reference.
|
|
(14)
|
Filed
as an exhibit to the Registrant’s annual report on Form 10-KSB for
December 31, 2005 filed with the Securities and Exchange Commission
on
April 14, 2006 and incorporated herein by reference.
|
|
(15)
|
Filed
as an exhibit to the Registrant’s current report on Form 8-K for
April 13, 2006 filed with the Securities and Exchange Commission
on April
19, 2006 and incorporated herein by reference.
|
|
(16)
|
Filed
as an exhibit to the Registrant’s current report on Form 8-K for May
25, 2006 filed with the Securities and Exchange Commission on May
31, 2006
and incorporated herein by reference.
|
|
(17)
|
Filed
as an exhibit to the Registrant’s Current Report on Form 8-K for June 26,
2006 filed with the Securities and Exchange Commission on June
27,
2006.
|
|
(18)
|
Filed
as an exhibit to the Registrant’s Current Report on Form 8-K for August 9,
2006 filed with the Securities and Exchange Commission on August
15,
2006.
|
|
(19)
|
Filed
as an exhibit to the Registrant’s Current Report on Form 8-K for August
23, 2006 filed with the Securities and Exchange Commission on August
29,
2006.
|
|
(20)
|
Filed
as an exhibit to the Registrant’s Registration Statement on Form S-8 (Reg.
No. 333-137663) filed with the Securities and Exchange Commission
on
September 29, 2006.
|
|
(21)
|
Filed
as an exhibit to the Registrant’s quarterly report on Form 10-Q for
September 30, 2006 filed with the Securities and Exchange Commission
on
November 20, 2006 and incorporated herein by reference.
|
|
(22)
|
Filed
as an exhibit to the Registrant’s Current Report on Form 8-K for October
4, 2006 filed with the Securities and Exchange Commission on October
10,
2006.
|
|
(23)
|
Filed
as an exhibit to the Registrant’s Current Report on Form 8-K for October
2, 2006 filed with the Securities and Exchange Commission on October
12,
2006.
|
|
(24)
|
Filed
as an exhibit to the Registrant’s Current Report on Form 8-K for October
17, 2006 filed with the Securities and Exchange Commission on October
23,
2006.
|
|
(25)
|
Filed
as an exhibit to the Registrant’s Current Report on Form 8-K for December
14, 2006 filed with the Securities and Exchange Commission on December
15,
2006.
|
| PACIFIC ETHANOL, INC. | ||
| |
|
|
| By: | /s/ NEIL M. KOEHLER | |
|
|
||
|
Neil
M.
Koehler
President and Chief Executive
Officer
|
||
|
Signature
|
Title
|
Date
|
||
|
/s/
WILLIAM L. JONES
William
L. Jones
|
Chairman
of the Board and Director
|
March
12, 2007
|
||
|
/s/
NEIL M. KOEHLER
Neil
M. Koehler
|
President,
Chief Executive Officer (Principal Executive Officer) and
Director
|
March
12, 2007
|
||
|
/s/
JOHN T. MILLER
John
T. Miller
|
Chief
Operating Officer and Acting Chief Financial Officer (Principal Financial
and Accounting Officer)
|
March
12, 2007
|
||
|
/s/
TERRY L. STONE
Terry
L. Stone
|
Director
|
March
12, 2007
|
||
|
/s/
JOHN L. PRINCE
John
L. Prince
|
Director
|
March
12, 2007
|
||
|
/s/
DOUGLAS L. KIETA
Douglas
L. Kieta
|
Director
|
March
12, 2007
|
||
|
/s/
ROBERT P. THOMAS
Robert
P. Thomas
|
Director
|
March
12, 2007
|
||
|
/s/
DANIEL A. SANDERS
Daniel
A. Sanders
|
Director
|
March
12, 2007
|
|
Exhibit
Number
|
Description
|
|
|
21.1
|
Subsidiaries
of the Registrant
|
|
|
23.1
|
Consent
of Independent Registered Public Accounting Firm
|
|
|
31.1
|
Certification
Required by Rule 13a-14(a) of the Securities Exchange Act of 1934,
as
amended, as Adopted Pursuant to Section 302 of the Sarbanes-Oxley
Act of
2002
|
|
|
31.2
|
Certification
Required by Rule 13a-14(a) of the Securities Exchange Act of 1934,
as
amended, as Adopted Pursuant to Section 302 of the Sarbanes-Oxley
Act of
2002
|
|
|
32.1
|
Certification
of Chief Executive Officer and Chief Financial Officer Pursuant to
18
U.S.C. Section 1350, as Adopted Pursuant to Section 906 of the
Sarbanes-Oxley Act of 2002
|